In this article, I am going to describe how to connect to Web as a data source in Power BI desktop and create different visualizations based on the webpage data. We can take any webpage url and use the data to create a handsome report in Power BI desktop. To achieve this, we need to go through some phases. First, we will import data from web url into our Power BI Desktop, then we will go through the cleaning the data process phase in Power Query Editor and after that, we will create some visualizations in the canvas. So, let’s go through each phase. There is one thing to note if there is an authentication present in the website, you are not able to get the data of that website. This only works for the urls which have basic authentication.
Jump to Section
Connect to a Web Data Source
I have described this process in my other blogs too. I hope now you understand this process. Still, for the new users, I am describing it one more time. Let’s go through step by step.
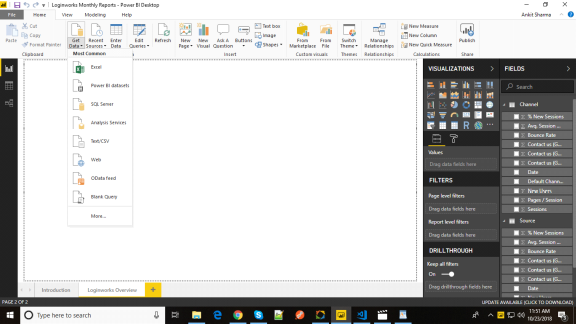
1. First, click on Get Data as shown below.
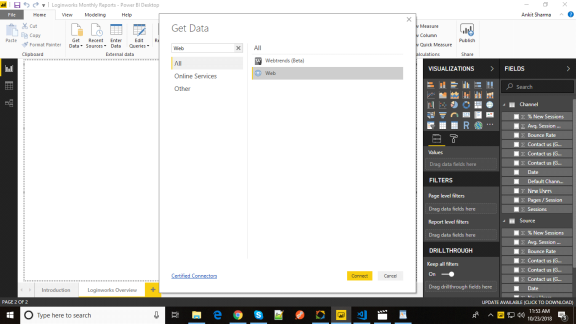
2. Click on ‘More‘, a new popup will open and within the search box enter ‘Web‘ and then Connect as shown below.
3. It will open a dialog box. Now you need to enter the webpage url which you want to import in Power BI desktop. There are two processes Basic and Advanced. In Basic, it will give you the complete webpage data and in Advanced you can specify the parts of the web page and it will only provide that much data.
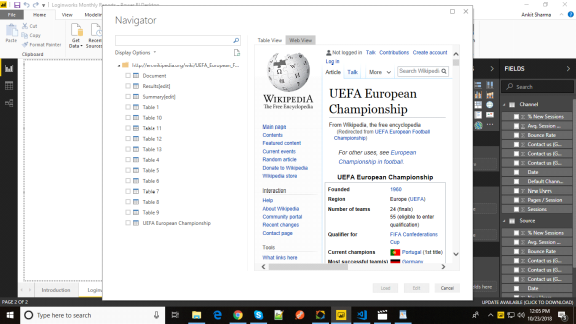
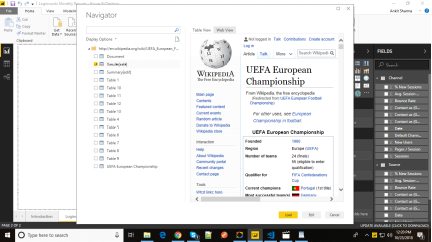
Actually, I am a big fan of football so the data I am going to fetch is UEFA European football championship data and the url I am going to use is http://en.wikipedia.org/wiki/UEFA_European_Football_Championship. You can visit this link to check the webpage.
4. In this step, we are going to paste this url in the dialog box. After this, a navigator window will open which looks like this. There are two views present. One is your Table View and other is your Web View which shows you the complete website page. In the left, you can check there are so many tables present. You can click and view any data in the table
So, before loading the data into the PowerBI desktop let’s do some cleaning first in Power Query Editor to make data more meaningful and this is our second phase to complete the process.
Edit data in power Query Editor
So let’s start the second phase. Choose any table, I am going to choose Results[edit] and click Edit. It will open the table in Power Query Editor. The data look like this.
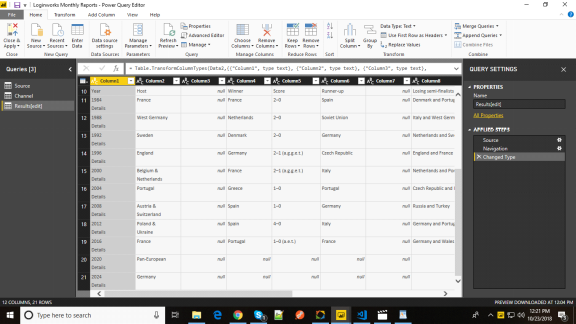
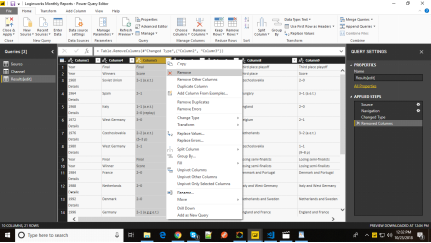
You can edit them according to your requirements. I am going to create two simple visualizations. TO create these visualizations, I only need two columns. One is your Year column and the other one is Final Winners. Except for these two columns, remove other columns. To remove a column:
1. Right click on the column and then click Remove as shown below. Apply this step to all other columns too.
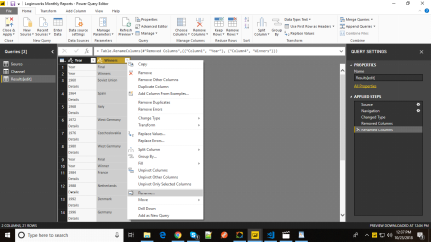
2. You can rename the column name. Right now it is just showing the column 1 which is meaningless. To rename the column follow the same procedure as above but instead of clicking Remove you need to click Rename as shown below.
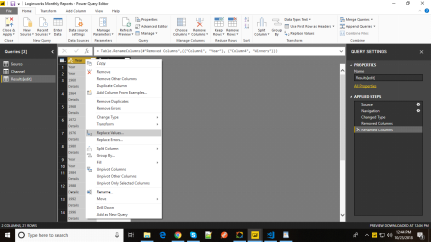
3. If you check properly in our data column, there is details field extra which is of no use. So, we need to remove it actually Replace it. To replace a value right click on the Year column and click on Replace Values.
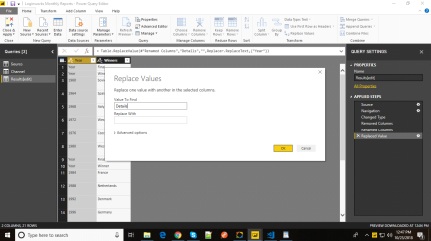
4. Now you need to enter the value you want to replace and value Replace with. In our case first we will enter details and the second text box will leave it as blank because we are replacing it will null value.
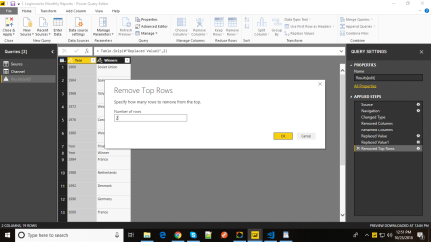
5. Also, we want to remove the first two rows as they are showing the column name. To remove rows click on Remove rows and then Remove Top Rows and then pop up will come in which you need to specify the total number of rows to be removed. In our case, it is two so enter 2 and click OK. You will see the top two rows has been deleted.
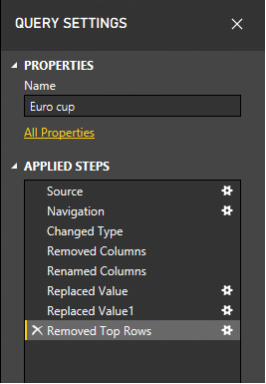
6. One more thing I want to show you the right side of the Query Editor is Query Settings. Within Query Settings there are two boxes one is your Properties and second is your applied step. In properties, there is a Name field. Within name field the table name is showing. You can edit the table name and also you give some description too if you want that is optional.
Second is the Applied Steps. This shows all the steps which we have applied like Changed type, Remove columns, Replace Value and Removed Top Rows.
7. The final step is to click on close and apply on the top left corner of your screen and now data has been imported successfully and now we will move to our next phase.
Create Visualization
Now, data has been imported. It’s time to create the visualization. I am going to create two visuals one a map and another one is a pie chart.
Create a Map visualization
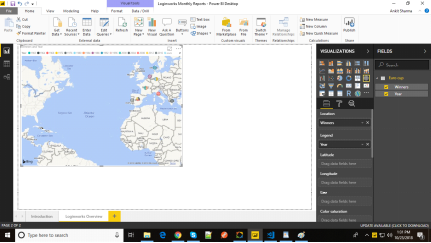
Select the map visualization from the visualization pane and drag the Winners Column into the map and also drag the Year field into the Legend and now you can put your own styling. I am not going to explain this here as it should be done by you. The map looks like this.
You can create the different visualization like pie chart, donut chart, bar chart. etc. I leave it for you as a practice.
Conclusion
In this article, I have explained to you how you can connect to a web url and then how to clean the web data according to your requirements and then create a visual by using this data. If you want to know how to create a complete report in Power BI desktop, I have written a complete blog on that particular topic. You can check it there. Also, I have written many blogs on Power BI. I just want to know your response. If you think any blog is useful for you then please write your ideas in the comment section. Not just the review, if you have any query or facing any issue you can post your query as well. Thanks!
I excel when it comes to making bespoke data dashboards and visualizations that users and clients absolutely love. Sharing about things I enjoy doing is my hobby, whether it's about a project, collaboration, feedback, or just simple how-to guides about visualization.
If you have something to ask or share, I'd love to hear from you!
- Business Intelligence Vs Data Analytics: What’s the Difference? - December 10, 2020
- Effective Ways Data Analytics Helps Improve Business Growth - July 28, 2020
- How the Automotive Industry is Benefitting From Web Scraping - July 23, 2020
Thanks for this usefull apps…