Retailers analyze historical sales data to identify trends, seasonality, as well as random behavior with Power BI
Jump to Section
What is Power BI:
Power BI is a Business Intelligence and analytics service provided by Microsoft. It enables its end users to create their reports all by themselves without having to depend upon IT staff or database administrators. There will be interactive visualizations supported by business intelligence capabilities.
Power BI is a cloud-based service known as “Power BI service” having a desktop-based interface called “Power BI Desktop.” The service offers data warehouse capabilities including data preparation, data discovery and interactive dashboards. It gives you a view of your most complex business data throughout your organization. It can connect you to hundreds of data sources, produce excellent reports that can be published for your organization to be consumed on the web and across mobile devices.
The beauty of Power BI lies in the fact that you don’t have to learn new applications or languages to operate this desktop. The desktop is laced with tools to transform, analyze, and visualize data and makes it easy to share reports with your organization in seconds. This enables your team to make quick, confident decisions with a single view of your business.
You can easily build robust and reusable models over your data by using Microsofts’s SQL Server Analysis Services, thereby provide consistency across reporting and analysis in your organization. You can collaborate with key stakeholders and ensure that everyone uses the right data.
Furthermore, you can easily embed BI and Analytics within your Apps. With the embedded Power BI, you can deliver stunning reports in your app. You can integrate your service or application with Power BI to help you deliver your solutions faster without sacrificing the core values of your business.
There are situations wherein businesses need to report information from other applications and data sources that are mixed in a single Business Intelligence strategy. In such cases, pre-built ready to go solutions come to rescue. Dynamics 365 for Finance and Operations is now available with over 39 workplaces, each with multiple Power BI reports included within the user licenses.
Brief History of Power BI:
The idea of Power BI was first conceived by Thierry D’Hers and Amir Netz of the Server Reporting Services of Microsoft. The idea was further led and designed by Ron George in summer 2010 and named it Project Crescent that was made available for public download on July 11, 2011, under SQL Server Codename Denali. Later it was renamed as Power BI in September 2013 and made available to the public for Office 365.
Microsoft BI for Retailing Business:
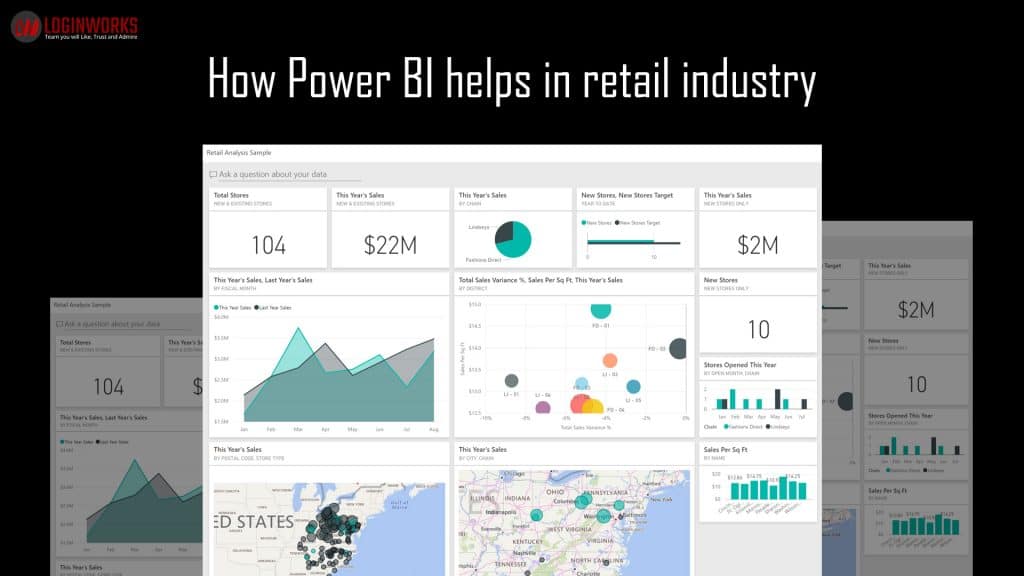
Microsoft’s Power BI is full of features, data building tool that allows retailers to visualize data and give employees access to insights about the things such as customer engagement, loyalty patterns through differentiated customer experiences. There is a suite of reporting, forecasting, and analytical tools that gives real-time access to enterprise sales trend data in any form; micro-segmented by demographics, or predictive modeling for accurate sales forecasting.
You can monitor the health of your business by using a live dashboard and can create rich interactive reports with Power BI Desktop. You can access your data on native Power BI mobile apps and can have a 360-degree view of your business on the personalized dashboard.
No matter where your data resides or in which form, on excel spreadsheets, streaming data or on-premises database, you can get a holistic view of your business status. With real-time Power BI dashboards, you can instantly know when your business needs your attention. So you can solve problems as they arise and seize opportunities as you get them.
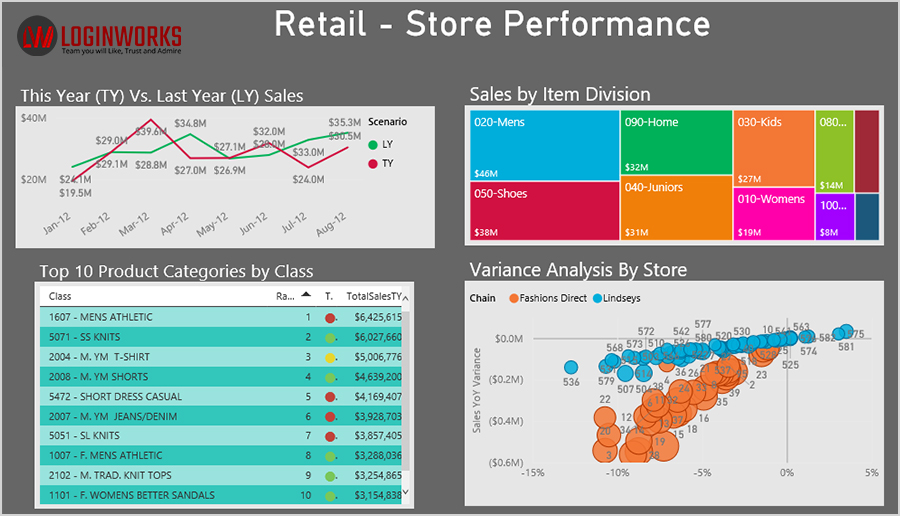
In the retail environment, effective promotion plays a vital role in product awareness and sales. Analysts can view past performance at stores to gain insight as to how discounts for different item categories and geographies may have improved overall sales.
Power BI Dashboard for Contextual Marketing:
Declining revenues, despite having a big marketing budget is the biggest concern for retailers. With the advent of a Power BI dashboard, you can put right strategy in place to optimize the marketing strategy and engage your customers more effectively.
Power BI dashboard for Retailers provides information such as- dwell time per visitor, peak hours of visitor traffic, new v/s returning customers list, most visited places in the shop/mall, etc. Its key benefit is that it puts everything in the same place. This centralization saves time and streamlines operations.
Trend Analysis:
An important feature that comes with the Power IB suite of analytics tools is Data Analysis Expression or (DAX). It provides a wide range of functionalities for trend analysis of a certain period with respect to current data. This can be done in such a way that the visuals keep updating dynamically by the current data. For example, every quarter for the last eight quarters trend or every month for the last twelve months trend can be analyzed.
Consider a scenario where we would like to show the Last 8 Quarter trend for Sales Analytics. If the current date is March 7th, 2019 which is in the First quarter of 2019 then the visual should show up values from the Second quarter of 2017 till the First quarter of 2019 summing up to 8 quarters altogether. Likewise, if the current date is May 7th, 2019 which is in the Second quarter of 2019 then the visual should show up values from the Third quarter of 2017 till the Second quarter of 2019.
- What Products Should You Sell on Amazon? - November 18, 2020
- 10 Reasons Why You Should Start Selling on Amazon - October 22, 2020
- Comparative Study of Top 6 Web Scraping Tools - September 3, 2020