How Big Data Analytics is supporting Digital Transformation in Banking?

The present digital era is powered by mobile devices and social media, where consumers now demand 24×7 banking and other services in real-time. Higher customer expectations, fast-changing payments technology, the complexity of transactions, lower margins, regulatory compliance, and intense competition from FinTech companies, are constant challenges faced by the banking industry. Traditional processes of data handling and legacy IT systems, are no longer sufficient to keep up with the fast pace of change in the financial services sector.

Why Banks Need to Revisit Their Data Policies

  • Instances of the banking system being used for fraud and terrorist financing have given rise to regulations spearheaded by global financial bodies like the FATF.
  • Stringent money laundering regulations with high penalties of non-compliance have placed further demands of ongoing risk management and compliance systems.
  • This involves stringent measures of customer identity verification and validation to be undertaken by banks.
  • Failure to comply leads to huge penalties. Some instances in the past where banks were penalised for non-compliance are the HSBC Group ($1.9 billion) and Standard Chartered ($327 million) in 2012, and the Deutsche Bank ($204 million) most recently in November 2017.
  • In India, banks like the Punjab National Bank have also been in the limelight for being unable to detect NPAs (non-performing assets) and taking corrective measures to mitigate huge banking losses.
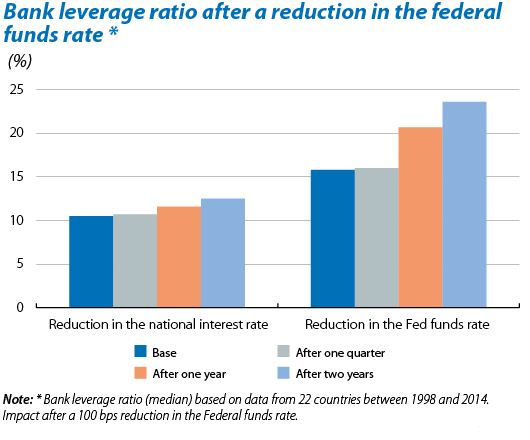
Graph: Bank leverage ratio after a reduction in the federal funds rate

This has driven banks to harness the huge volume of data assets to manage risks of fraud and errors while cutting costs and delivering more value to their customers.

  • The banking and finance industry is becoming a highly competitive marketplace with the emergence of financial technology (FinTech) companies using the banking infrastructure for value-added services.
  • In this environment of financial convergence where banks partner with financial service companies and e-commerce, banks are faced with the challenge of processing voluminous data across channels.

So the banking sector has witnessed an unprecedented digital transformation through the adoption of state-of-the-art technologies, with big data analytics at the core.

The Big Data Analytics Market in the Banking Industry
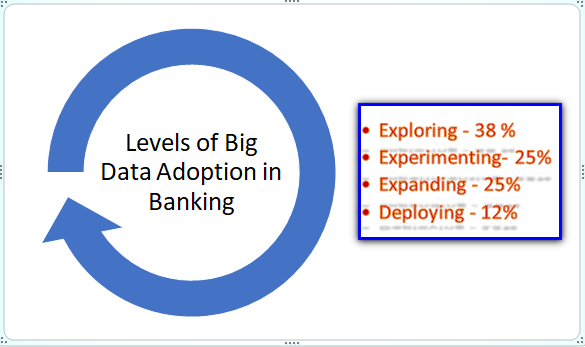
Graph: Levels of Big Data Adoption in Banking

According to the Research and Markets Report, the global big data analytics adoption in the banking industry was valued at US$ 7.19 billion in 2017. It is expected to grow at a CAGR of 12.97% during the period 2018-2023 to reach US$ 14.83 million by 2023. Big data analytics applications in banking are finding increased deployment in areas of Fraud Detection and Management, Operation Intelligence, Customer Analytics, Social Media Analytics, and Customer Relationship Management.

What constitutes Big Data in Banking?

  • In the banking industry, the amount of data generated is exploding.
  • Big data refers to the customer transaction data, data related to banking products like loans and investment services, operational data, as well as the data exchanged between banking institutions and financial partners.
  • The data is so humungous that issues like fraud management and customer risk assessment pose a huge challenge for banks.
  • However, with real-time high-end streaming analytics in a high-performance computing (HPC) environment, banks are able to find value from the big data.
  • Insights gained from the data enable banks to be regulatory compliant, manage fraud and money laundering risks, as well as more banking products, and ensure customer satisfaction.

Customer Data

Banks process huge amounts of disparate, multi-channel, multi-device data in real-time. Data related to customers include transaction data, credit card use, new customer onboarding, and due diligence checks, and customer behaviors across various channels of information, like chatbots and social media.
In a customer-driven marketplace, CEOs are faced with a number of challenges – gaining a 360-degree view of the customer, widening customer outreach across ever-increasing channels and countless marketing campaigns, while proving an effective Return on Marketing Investment (ROMI). With marketing strategies powered by data-driven insights, marketing managers are able to monetize the available data to achieve sales targets and enhance customer relationships.

Operational Data
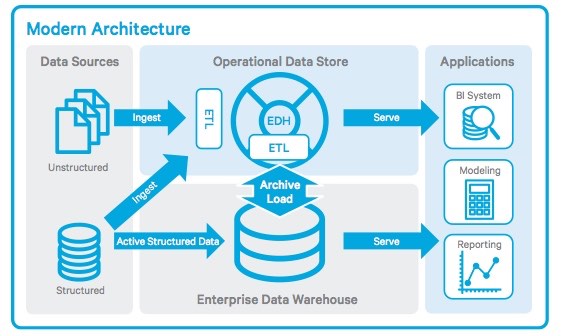
Modern Architecture of Operational Data

Like every other business or institution, banks have their internal data related to marketing targets, controls, bank workforce, suppliers, accounting data, and more. This operational data is core to reporting requirements, internal checks, the decision-support system of the bank, and optimal resource use.

Financial Data

Banks are profitable ventures that keep tight control on financial metrics, as their balance sheet governs shareholder confidence, brand image, and industry ranking. All this is with the goal of financial data related to its operations, incomes, legal expenses, and financial liabilities is maintained with due diligence.

Market data
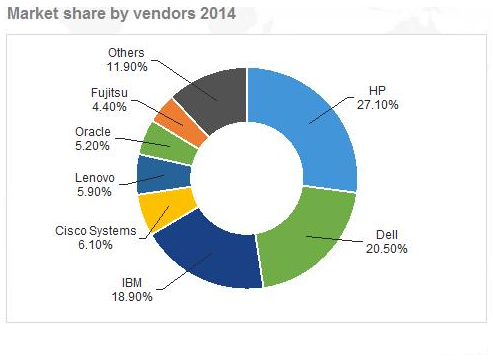
Market Share by Vendors

Banks collect data on the economy, social statistics, political trends, technological advances, stock markets, and financial market trends. They also collate strategic data surrounding the industry, which includes updates in the regulatory landscape, industry practices, and data on competitors and their products.

Risk assessment data

One of the key areas of banking operations is risk assessment. Risk data includes the entire spectrum of risk profile building, automated testing, analysis, and validation of controls, to name but a few. Analysis of risk data is critical for developing risk scorecards, notification of red flags, creating processes for control remediation, targeting high-risk areas, and making data-driven reports.

Why the Need for Big Data Analytics?

Banks process a “variety” of structured and unstructured data from various devices, mobile apps, social media, markets, transactions, customer behaviour, credit scores, chatbot conversations, risk assessment reports, sanctions screening updates, and so on. As banking processes occur in real-time across the world, the threshold of transactions per second is huge. With data created at high “velocity”, the analytics also needs to be quick for real-time actionable insights. For instance, when there is unusual activity in a customer account, the system needs to analyze the transactions in real-time for actions based on the data-driven insights. The “volume” of data processed is huge and can be up to terabytes of data per day. The genuineness of the data or “veracity” is another aspect of concern. Is the customer KYC data trustworthy? Does it need to be validated using third-party services?
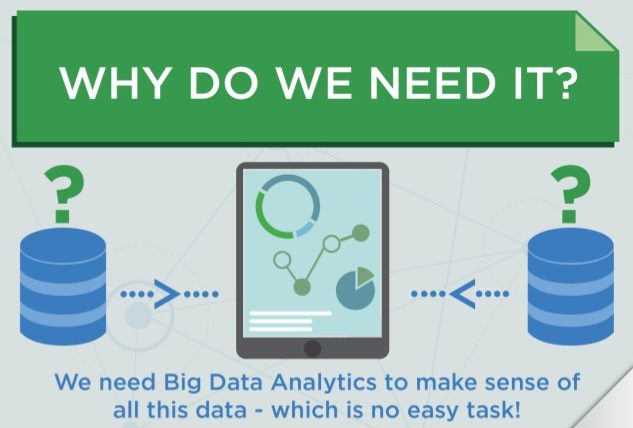
Why do we need Big Data Analytics

These challenges of big data have given rise to the “value” aspect, which applies big data analytics in real-time for data-driven insights for:

  • Fraud management,
  • Risk assessment, compliance & reporting,
  • Customer service,
  • Operational efficiencies,
  • Innovative banking products and services,
  • Profits.

Faster processing speed is the mainstay of faster analytics and quick decisions. The ability to detect anomalies and risks, or respond to market changes with upsells, can make the difference between huge losses and brand enhancement. Greater operational agility to respond faster to market changes is often the game-changer, with the capacity to save billions and ensure timely regulatory compliance. So banks are now transforming the vast data assets at their disposal into “valuable” insights at every level of data maturity. These insights hold the key to business success in a high-performing data-driven landscape.

The banking industry is part of the fiercely competitive financial sector. By using a data-driven approach, banks are able to deliver innovations in payments and services, enable instant detection of anomalous patterns in customer transactional data or suspicious internal data manipulation; for a higher ROI. Big data analytics powers the seamless and robust performance of a bank for a business edge.

How Big Data Analytics Is Powering the Banking Industry
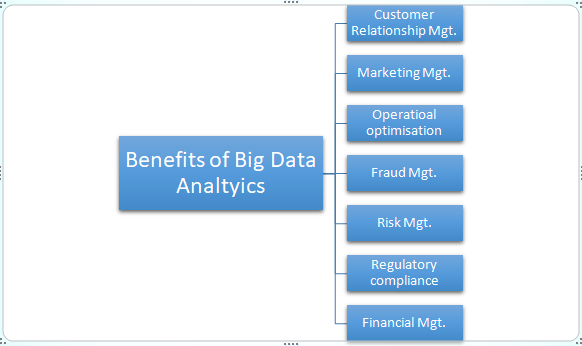
How Big Data Analytics Is Powering the Banking Industry

Big data is at the core of digital transformation in banking, defining how banks deliver value to the customers while remaining compliant with the laws. Increased customer confidence, expansion of banking operations, maximizing ROI on marketing investments, and mitigating risks, are some chief banking objectives. The enabler for the key goals of banking is analytics.

With banks keen to leverage big data analytics, the stakeholders are asking the question: “How can this data help us solve our business problems?”

While customer analytics is the key to outperforming competition across the full customer lifecycle, operational and risk analytics are also helping banks achieve operational efficiencies and reduce risks.

CUSTOMER RELATIONSHIP MANAGEMENT

Below, you can see how big data analytics help with customer relationship management.

Higher customer satisfaction (CSAT)

The huge datasets are fused together for a single 360-degree view of the customer. By tracking a customer’s social behavior and rigorously measuring the feedback, banks can improve and develop their products and services for effective CX. Customer transaction and behavior data are leveraged for an intuitive approach to customer expectations to power personalized service, tailor-made loan and credit card offers, higher CX, and brand loyalty.

Customer retention

Big data is used to develop key metrics and KPIs (Key Performance Indicators) related to customer activity, investments, channels of touchpoints, and more. Predictive analytics is applied to target customer retention campaigns for a bottom-line ROI.

Sentiment analysis of social media activity or customer response also drives loyalty programs, content-driven marketing, and social media techniques for effective CRM (Customer Relationship Management). This significantly reduces customer churn.

MARKETING MANAGEMENT

Customer engagement for longer CLV

Cross-channel data integrated seamlessly into all customer-facing channels, drive insights for longer customer engagement. Based on churn analysis, campaigns and upsells can be tailored to engage customers for longer customer lifecycle value (CLV).

Customer segmentation for tailored marketing campaigns

Customer segmentation helps banks understand their customers on a granular level. The huge customer data available with banks are used for segmentation by customer value, demographics, life stage, behavior, and touchpoints reveal specific intelligence. These data-driven insights, in turn, drive messaging strategies. Segmentation also helps banks better understand the customer lifecycle and predict customer behavior.

However, the real power of customer segmentation lies in the bank’s ability to drill down to the information where the segments overlap. For instance, a micro-segment like ‘Millennials who are starting their own eCommerce businesses’, can prove to be a valuable customer segment for banks to prioritize with customized loan offers.

New customer acquisition

In an increasingly competitive marketplace, banks need to have highly optimized data-driven customer acquisition strategies that capture new customers, as well as track the ROI on your marketing. This is fast-tracked using big data analytics.

Marketing Mix

Using social analytics, sales, and territorial figures, banks are building strategies around social media channels to reach more numbers of potential customers. Based on marketing metrics, banks are also implementing cutting-edge technologies like mobile check deposits and financial calculators, to attract more customers.

OPERATIONAL OPTIMISATION

Operational decisions are high-volume and repetitive in nature. Analytics of data such as contact center, CRM (customer relationship management) and ERP (enterprise resource planning), help optimize operational efficiencies and reduce costs. Operational analytics solutions transform the big data into insights for improved decision-making in near real-time, lower costs, and enhanced service at granular levels. Banks can outperform the competition with in-depth analysis of the performance of key operational areas, such as sales and operations planning. Analytics also builds models related to demand forecasting, inventory management, network optimization, and HR (human resource) operations across the banking infrastructure, including its branches and various departments.

FRAUD MANAGEMENT

Big data analytics used together with other technologies like Machine Learning (ML) and Artificial Intelligence (AI) help differentiate, for instance, unusual customer activity based on the customer’s history, for fraud detection. The analytics systems suggest immediate actions, such as blocking such irregular transactions or informing the customer, to stop fraud before it occurs.

RISK MANAGEMENT

While every business needs to engage in risk management, it is of utmost importance in the financial industry. Regulatory schemes such as Basel III require firms to manage their market liquidity risk through stress testing. Banks need to follow these risk assessment methods, as well as manage their customer risk through analysis of complete customer portfolios. Banks also manage the risks of algorithmic trading through back-testing analysis against historical data. The biggest use case of big data analytics is in supporting real-time alerts if a risk threshold is surpassed.

REGULATORY COMPLIANCE

Financial services firms operate under a heavy regulatory framework, which requires significant levels of monitoring and reporting. Banks have to monitor transactions and documentation in detail, as part of AML/CTF (anti-money laundering/counter-terrorist financing) compliance and trade surveillance. Big data analytics helps identify financial activities that do not conform to regulations or abnormal trading patterns.

FINANCIAL MANAGEMENT

Big data analytics deployed across financial dashboards and statements give a detailed, data-driven view of the financial picture. Financial KPIs help answer specific business questions and to forecast possible scenarios, analyze performance against budgets, real-time monitoring of financial indicators, and so on. This helps bottom-up accountability as well as supports timely decisions based on data-driven insights. Analytics of financial data forms the mainstay of shareholder confidence, budgetary allocations, and HR decisions.

Bottom line

The banking industry is one of the fastest-growing industries that has already integrated big data analytics within its system for a competitive advantage. Due to both regulatory requirements of AML/CTF compliance, and the value of big data analytics, banks will continue to implement more and more big data analytics projects across their operations.

Top 5 Advanced Techniques of Data Analysis

What is Data Analysis?

Data Analysis is the new emerging way of find out statistical patterns and relevant information by using data analysis. Data Analysis contains a set of processes like Data Modelling, Data Integration process, Data processing, and Data Evaluation etc. By using data Analysis, you can easily divide a big number of data sets into a small piece of statistical patterns, later you can feed them in the database easily.

WHY DATA ANALYSIS?

We live in a digital era where data converts in a Nanosecond that is much faster than a normal human capability. In the corporate sector, employees work on a large volume of data which is extracted from different sources like Social Network, Media, Newspaper, Book, cloud media storage etc. But sometimes it may create some difficulties for you to summarize the data. Sometimes when you fetch the data from other sources, you cannot predict that how much data will be stored in the database.

As a result, the data set becomes more difficult and takes enough time for analyzing the process. So, let’s explain the solution to this problem. Try to fetch data sets in the form of a new category and retrieve the data type whatever data type you want for data filtration. Data Analysis technique provides the good amount of data quality. Excel is the best tool for data Analysis process. Data Analysis is much useful in Corporate Analysis, Data management, Market Analysis, Risk Management, and Fraud Detection.

BENEFITS OF DATA ANALYSIS

  • Data Analysis attributes can easily find the missing patterns from the inconsistent data that increases the optimization speed of the optimal result.
  • If you work in a consistent way until the deployment of the business objectives that increase the brand loyalty that will really help you in marketing campaigns. The benefit is that customers can directly communicate with the organization to serve better.
  • By the completion of project delivery to the stakeholders/customers, that surely increases the trust in your organization and the work that you delivered. It simply can increase your customer base.
  • Data Analysis techniques and tools help in making the big decision to increase an organization’s revenue.
  • By using data Analysis, it can convert complex and inconsistent data into a general structure that customer can understand easily.

Top 5 Techniques of Data Analysis

  1. Classification Analysis
  2. Excel Analysis [V-H Lookup]
  3. Pivot Table
  4. SQL Analysis
  5. Regression Analysis

CLASSIFICATION ANALYSIS

Classification analysis is used to find relevant and important information of the metadata and data sets. This analysis is used to retrieve the different type of data in different class objects. Classification is just like as clustering that segments data format into different segments called object classes. Unlike classification, data analysts contain data for different cluster or classes. So, you need to apply classification algorithms analysis to find out that how newly stored data should be verified. For an example, an Outlook email is the best example of classification algorithm analysis. In Outlook, algorithms are used to characterize the format of an email as spam or legitimate. Classification algorithm contains its properties as follows

Classification Analysis methods for analyzing the data.

Logistic Regression Classification: This type of analysis technique provides machine learning analysis algorithm for data classification. In this classification, the probability describes the possible result of data modeling by using a logistic method function. Logistic regression is highly designed for only classification purpose and is used to understand the influence of independent variables at a single outcome of the dependent variable. But it will be used only when the predictive variable is binary that means all variable are independent of each other.

Naïve Bayes: This kind of classification algorithm is totally based on Bayes’ theorem that works with the prediction in each pair of independence features. Naive Bayes theorem works well in several real-life situations like as spam filtering and document classification. This algorithm contains training data to evaluate the required parameters. But Naive Bayes is well known for its bad estimator formula.

Excel Analysis

Excel is the most powerful feature of data analytics that is used to determine the data in terms of Insertion of the data, data computation, modification of the data, and deletion of the data. It is a most sophisticated data analysis tool. Excel provides a way to solve big data in a wide variety of formats like VBA, Macro, Function, and Pivot filters. I would prefer to learn first excel if you are trying to go for R and Python programming languages. So, I will tell you about the whole concept of data analysis technique of excel.

There are many data analysis techniques as follows.

Lookup Functions

These functions retrieve data from the excel database in a quick manner. These are very powerful functions and widely used on a daily basis work in the corporate world. Lookup functions are also can be used within sheets and with multiple sheets at the same time. For this reason, you will have to provide a data range for data result. V-lookup and H-lookup both are types of lookup functions. So, let’s understand how it works for data analysis.

V-lookup function

This lookup function works vertically in the sheet and it helps to find out the corresponding record in a table. So, let’s understand this lookup function as follows.

First of all, create a table in excel. I have already created a table below. There are 8 columns like as Name, Policy Amount, Joining Date, DOB, PINCODE, RAILWAY CODE, AGE, and ADDRESS. By default, Excel takes text number values. Although, it does not change automatically as it is case sensitive formula. If ever you define a date format you will have to convert its text to date by right clicking on “Format Cells”. In the column “Joining date” and “DOB” will be shown in their real format.

Now, I want to retrieve all details of “John” from the table. Here, is the result as follows.

Output

Now, understand how it happened. I have just created a formula of V-lookup and syntax like as =Vlookup (lookup_value, table_array, Col_index_num, [range_lookup]). First of all, it selects a lookup value that means the target value that you need. Second, define table range including column names. Third, provide the index number of selected column name that is required for. Fourth, range lookup that means either False or True. You can also put 0 or 1 for range lookup because 0 indicates False and 1 indicates True but if you choose False that will give you an exact result and if you go with True that gives the appropriate result but not exact as False.

So, I recommend that if you want to find the exact result of a particular search value then select False. In the above result, once you apply the formula you will get an only single result. For this reason, if you need all the details just drag the bottom right corner of a selected cell to the right side of the sheet.

Note: Lookup functions always work from left to right but not right to left and it takes search value from the rows.

H-lookup Function

This lookup function works horizontally in the sheet and it helps to find out the corresponding record in a table. So, let’s understand this lookup function as follows.

Now, I want to retrieve all details of “John” from the table. Here, is the result as follows.

So, let us understand what just happened in the result. I have just created a formula of H-lookup and syntax like as =Hlookup (lookup_value, table_array, row_index_num, [range_lookup]). It gives the opposite result as V-lookup does. Because it only selects column value to provide the final result. These are very useful excel functions that are used in a broad way.

Pivot Table

A pivot table is a key program feature that allows data to summarize & reorganize selected multiple rows and columns in a database table or spreadsheet to get the desired report. It a mainframe of excel database. Hence, a pivot table can solve a big amount of data set in one excel sheet. So, let’s just understand with a real example. For this reason, I have taken the bulk data as follows.

Now, I want to fetch the total amount from the table where the country name should be “India” and Model Name should be “Apple”. So, let’s figure this with applying pivot table. First of all, select the complete table and open the insert row from the toolbar. Then, select pivot table and you will see two options (New Workbook and Existing Workbook). If you choose new workbook then pivot table framework will show in the new spreadsheet but if you go with existing workbook then it will show on the same sheet where you created the table.

After setting up pivot table your sheet will look like as.

Here, you will see two frameworks first one will get you the result and another allows you to filtration of columns. Remember, pivot table framework always select column names. So, let’s start finding the result.

A pivot table is a process of drag-n-drop of column fields. It is a commonly used function in excel. In the above example, I just drag-n-drop three columns (Country Name, Model Name, and Turnover). It is very simple and flexible. Because you can change its result layout by showing the same result as follows.

These 3 pillars of excel is commonly used to analyze the data in a quick manner. It is very simple and easy to learn for beginners.

Data Analysis through SQL

SQL is known for Standard Query Language. Although, SQL is not a language but a framework or tool that is used to solve millions of data in a quick manner by using its features. SQL is totally depending on tables and its functions. It provides data addition, insertion, and deletion etc. It contains four commands like as DML (Data Manipulation Language), DDL (Data Definition Language), DCL (Data Control Language), and TCL (Transaction Control Language).

Now, let’s do some practical analysis using SQL. So, let’s assume a table “Student” as follows.

Now I want to fetch details of “ID=1” from the table Student.

This is a very basic analysis I explained. There are a lot of functions like SQL Joins, Views, and Index. By using these functions you can solve bulk data easily.

Regression Analysis

This type of analysis is used to define predictive modeling that further evaluates the relationship between an independent variable that defines as a predictor and dependent result. This technique is mainly used for time series data modeling, forecasting, and finding the effect of the data variables. Understand with an example, a relationship between the road accidents and fast rash driving is the best example through regression. Regression analysis is a very useful tool for analyzing data and data modeling.

Regression analysis works independently by using mathematical equations. So, let’s understand with an example. Global warming contains the reducing average of snowfall and predicts how much snowfall you think will fall in this month. Now, look at the existing table that you could guess around 11-20 inches. That’s a nice thought, but you could guess better than this with the help of the regression chart.

Conclusion

In the end, we have learned the top techniques of data analysis. If you want to serve better for your corporate world then choose these analysis techniques. There are more data analysis tools and techniques available in the market but I only explained these 5 techniques of data analysis. Because these techniques are being used in today’s corporate world. I hope you enjoyed my article.

Top 10 Reasons Why Data Analytics is Good for Healthcare Industry

Introduction

Everyone at some point or the other comes down with an illness. We go to the hospital and expect to be in the safe hands of a physician whom we expect to know everything about the sickness and give the right dosage of medicine right? Well, CBS news reported that 12 million Americans are misdiagnosed each year. Physicians are very smart, undergo rigorous training and do everything they can to stay up to date but everyone makes mistakes. Doctors are still humans and can forget, have an oversight or even human error. Also, even if physicians have access to a lot of data needed to treat a patient, it would still take some time for the doctor to modify those data to suit the patient’s unique illness.

People are becoming more conscious about their health, people use wearable devices to monitor heart rate and other vital body organs. Record keeping, compliance and industry regulation creates lots of data for the healthcare industry. Raghuapathi and Raghuapathi, said in 2011, the US healthcare alone reached 150 Exabyte of data. Data analytics expert at Quantzig said, “Analytics help healthcare industry players to form this data and leverage them to derive meaningful insights.” Hence, the healthcare industry is turning to data analytics to help make their services easier and better.

Data on its own is useless, it has to be analyzed by a team of experts to make anything meaningful out of it. In order to get the best results from data analytics, the data has to be clean. Dirty data has to be ‘scrubbed’ and ‘cleaned’ so they can be accurate.

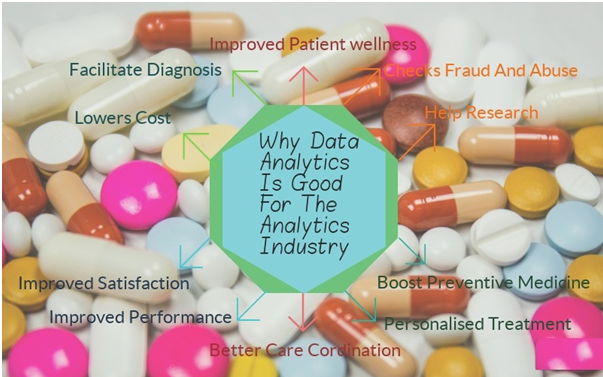
Ten Reasons Why Data Analytics Is Good For Healthcare Industry

1. Lowers Cost: Data analytics lowers administrative cost to the hospital and reduces the cost to the patient. From statistical data, it is shown that a quarter of healthcare cost goes to administrative cost mainly because humans are required for administrative tasks.

Data analytics can also help predict cost for employers that provide healthcare benefits for their staff. The company can use its own database, liaise with insurance companies and the hospital to get the best price and most effective services for their employees.

Hospitals, insurance service providers and pharmaceutical companies can have better control over their supply chain. With better data on what medications or services are most required at the moment, the health industry can make just the right amount of orders leading to significant increase in savings. Increase in savings means more profit for the pharmaceutical company.

2. Facilitate diagnosis: Data analytics can facilitate a clinical decision. It can bring all prescribed medicine, lab test report and medical history of a patient to a single screen. This can help the clinical team to see a fuller view of the patient’s condition and give a better prescription.

Furthermore, data analytics can help the medical team to make a better-informed decision on otherwise tricky cases. For instance, a patient with chest pain in the ER might not necessarily need to be hospitalised. This is often difficult for doctors to know, however, if the doctors enter his complaints, pain points along with their medical judgements, the system can give information on the safety of the patient if sent home.

It is important to note that data analytics doesn’t replace the sound judgment of the medical team. It is only to aid them in making better and informed decision.

3. Check fraud and abuse: Fraud and abuse is a big hole in the pocket for the healthcare industry. According to Payer Fusion, fraud and abuse are estimated to cost the health industry $80 billion in value.

Fraud includes inflating bills, falsifying records, changing or extending dates or magnifying services rendered to make more money. Abuse, on the other hand, is overbilling the patient, rendering services that the patient does not require or not maintaining a proper record.

Data analytics makes the process of payment transparent and also monitors how doctors are treating their patients. This ensures the patient is not exploited or the health system cheated by the patient. George Zachariah, a consultant at Dynamics Research Corporation in Andover, said, “Analytics can track fraudulent and incorrect payments, as well as the history of an individual patient.” He further mentioned that “However, it’s not just about the analytic tool itself but understanding the tool and how to use it to get the right answers.

4. Better care coordination: Data analytics can help with better care coordination among hospitals. Lisa Rapaport’s article on Reuters Health, 2017, revealed that few American hospitals share electronic records. She said more than one-third of hospitals report never using it and less than 50% report actually having the electronic data of their patients. This is an improvement because only 30% of Hospitals reported having electronic data of their patient in 2015.

About 96% of hospitals that have digital records do not share these records among themselves. This is like Windows not being able to send an email to Mac OS. The major reason put forward by hospitals is the amount vendors charge to link hospitals together. Farzad Mostashari, the former Health IT czar at HHs said, “And the vendor is saying, ‘Oh, OK that will cost you $50,000.’ Now, does it cost the vendor $50,000 to build a standard interface? No, it doesn’t cost them $50,000,” he further mentioned, “It’s their opportunity to make a buck.” Data analytics helps create a centralised system that all hospitals can plug into without having to pay exorbitant prices.

However, hospitals need to improve on sharing patients’ record because, without a system that can extract a patient’s medical history, the patient’s family would have to go from hospital to hospital to get previous records. This can increase the physical, emotional and psychological burden on the family and patient.

5. Improved patient wellness: Hospitals can use Data analytics to check on and monitor their patients. They can use data analytics to ensure that their customers are living a healthy lifestyle. This gives doctors the ability to monitor their patient’s health and well being.

Patients can also work closely with doctors being better informed about their health. Patients would use apps or wearable devices to monitor their vitals. This data can be automatically received by the doctor and he can advise on the best health practice for the individual. This precise data passed to the doctor would give a more accurate prescription for the patient.

6. Improved staff and customer satisfaction rate: Hospitals can monitor and improve on both staff and customer satisfaction. With the aid of data analytics, the medical can be more confident in the decisions they make. They are less stressed because medical conditions that might take hours to diagnose or take decisions on can be done in few minutes. The medical team can also handle more patients in a given time period.
Patients’ conditions are also more accurately diagnosed. They’d receive medications that would work best for them and would not have to use medications that work for most people.

7. More visibility into performance/boost competitive advantage: Hospitals can have more insights into their performance. They can easily have information such as check-in time and the time taken to respond to a patient. The management team can have a full view of where they are lacking and can improve their services.

Hospitals using data analytics make better informed medical decisions on patients and would have better treatment. This would lead to increased patronage and of course with a better system to manage patients, the hospital can manage more patients per time, leading to an increase in market share because they’re using data analytics that’s giving them a competitive advantage.

8. Help researchers develop models: Researchers can now develop models without needing to have years of data or thousands of samples. Data analytics can provide data for researchers and this can improve with accuracy over time.

There are two ways data analytics help researchers in the health sector. Data experts can use predictive analytics or initial models. Predictive analytics uses information in its database. It uses statistical tools to draw conclusions and predict future trends. On the other hand, researchers can use initial models in which they start with a small number of cases and then accuracy is increased over time as more cases are added. It is a learning model that adapts with present-day knowledge and improves in accuracy over time.

It is important to note that researchers need to make use of data across different platforms or electronic data owned by different hospitals. In order to help researchers, the government has mandated electronic records to be compatible with one another. A program really useful to researchers is STATISTICA. STATISTICA is a program that has been used across industries including banking, pharmaceutical companies, and government agencies. This program works seamlessly with more popular programs like Microsoft.

On the other hand, researchers have to pay for data from some companies. However, researchers may find that these systems may not compatible with the industry standard. Using non-compatible data can be grievous when dealing with human life. Therefore, a central system like data analytics working across different platforms is really advantageous.

9. Boost preventive medicine and public health: Data analytics can diagnose diseases very early. Doctors using analytics are detecting diseases a lot earlier before they can become life-threatening. Terminal diseases such as cancer if detected early gives the patient the longest time frame possible to live. Early detection is key in treating many medical ailments or conditions. Data analytics help in spotting these diseases early enough.

10. Personalised treatment: Patients can receive personalised treatment with the help of data analytics. Medications that work for the larger population may not work for a selected few. These few can have medicines made by the pharmaceutical industry targeted at them and this can be very lucrative for the industry. Doctors, using data analytics can prescribe a medication best suited to the patient and not prescribed based on popularity.

Conclusion

A number of health workers express concerns about systems such as data analytics replacing them at work. Although, a robot in China, developed by iFlytek, has successfully passed the country’s licensing medical exam. Liu Qingfeng, chairman of iFlytek, said, “We will officially launch the robot in March 2018. It is not meant to replace doctors. Instead, it is to promote better people-machine cooperation so as to boost efficiency.” In medicine, treating humans requires the human brain. Analytics systems are tools to help the medical team to make better decisions and not to eliminate doctors. Hospitals using data analytics are getting well ahead of their competitors in the industry. Do you want to have a competitive advantage in the health sector? Then get on board with data analytics. It is a formidable tool.