Do your audience interact with you on social media? Do you want to spark more audience engagement? While it’s relatively easy to get people to like and share posts, but it takes creativity to drive comments and dialog.
This article can guide you about four main kinds of reports to define the right approach of data usage for finding your target audience.
Jump to Section
1. Demographics Reports
Being aware of your audience will help you to improve your social engagement with them. It generates content according to their preferences and needs.N ow, you have a chance to find out something about them. Demographics reports can help you to identify an average social visitor which are listed below.
Facebook Page Insights
Facebook, a most popular social media marketing tool carries a glut of information about your fans and followers through your brand’s home page. There is ‘People Engaged’ section which shows the demographics like age, groups and genders of the people who are more tending to actually engage with your posts on Facebook. That’s why it’s a key advantage to figure out your main audience and create posts served better to their interests.
Twitter’s Analytics Solution
Twitter by its analytics dashboard provides the possibility to get insights into the structure of an audience. Twitter’s solution comprises of information about their demographical characteristics such as gender, educational level, age and many more. This data will help you to produce the right content which will be perfect to catch your Twitter audience and make them interact with you.
Google Analytics
It is a powerful tool which offers analytics for those who cannot afford to generate their own analytics system. Google Analytics has always been very good at telling you what people have been viewing and clicking on your website. In the past, you always had to guess what type of people were coming to your site. You would have no idea whether you were reaching the target market you thought you were or if specific products or platforms brought in people older or younger than you imagined. The launch of the Demographics reports in 2013 means we could now have some very powerful data at our fingertips. This makes us understand our website audience much more better. You can find a variety of reports in the Overview section. In order to get there, you should go to your Google account > Audience > Demographics > Overview.
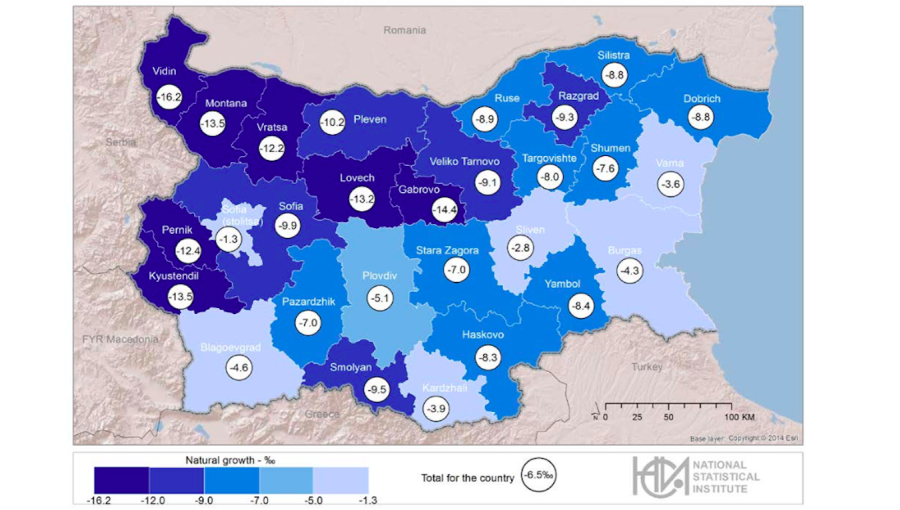
2. Language and Location Reports
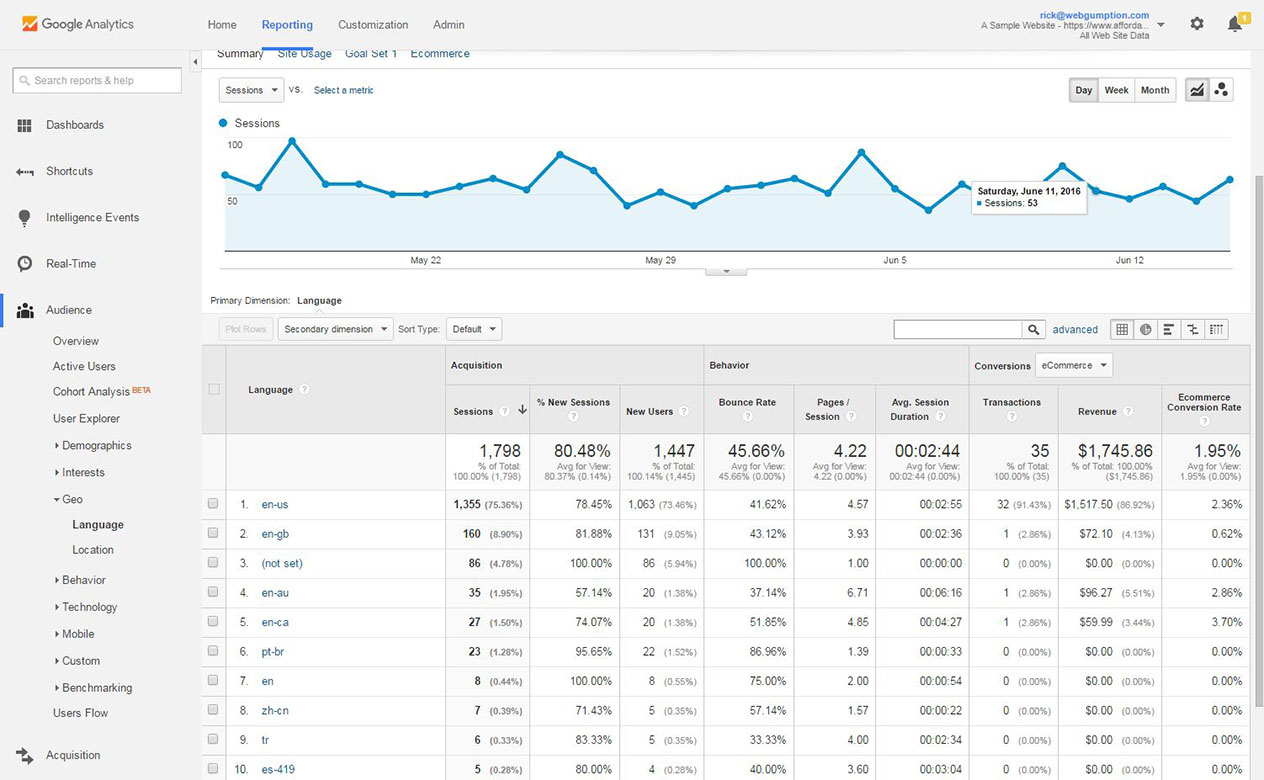
Language and Location Reports are very powerful in social media marketing solution. You can find the most engaged places all over the world, find out what is the most engaged country or even the city. These records will help to correct your marketing strategy and specify content for locations where a better response is obligatory. The Languages report is among the most cryptic of the reports in Google Analytics. It looks like you need a secret decoder ring to figure out what it’s telling you. Here’s some guidance on what those codes are and what they mean.
Facebook Page Insights
You can get this on the Facebook Page Insights, just below the age and gender information. You’ll find data on where the people visiting your page are positioned. And thus a data more suitable and according to the preferences including the language of that particular location can be drafted in order to make it more engaging.
Twitter’s Analytics Tool
Twitter’s Analytics Tool finds location information when you access your Twitter Analytics the same way. You’ll only need to navigate over to the second tab. In the right column, you’ll find information about followers both the country and region they belong to.
Google Analytics
This report is very similar to Google Demographics Reports. It provides an opportunity to divide location data according to your needs. Location information can be found in the following categories like Continent, Subcontinent, Country and City.
3. Sent Message Reports
Once you are aware of your target audience, it’s high time to think about message. You should use data from the reports mentioned above for creating content that will suit particular audience in a convinced geographical area. Also, rely on your experience based on already published content that received good engagement. You can view a report for every message sent through the Contact Center and Elists. This report will allow to view a copy of the email to whom the message was sent and errors during the sending process. These reports can analyze old content and provide you with useful suggestions
Followerwonk
Twitter has a new solution -Followerwonk. As the main metric for defining most important tweet, this tool uses retweets. In other words, the more retweets the tweet gets, the more relevant its content is within certain periods of time. According to obtained results, you can decide how to improve your content in order to get more engaged users.
Sprout Social
Sprout Social is a management platform for social media which gives an opportunity to analyze your past social media performance. It has a set of performance indicators and you can see which of your content is good and which should be improved.
4. Day and Hour Reports
Day and Hour Reports give you the next point to figure out a suitable time for posting your content. Again, there are some reports that can help you to deal with this issue. The main advantage of these reports is that they can estimate the right time specifically for your business, because the best time for one product may not be appropriate for another.
Facebook Page Insights
This report provides time data when your target users are online. However, it doesn’t mean that if you post content on the spot. It means that you will get the highest number of engaged users. So publishing content during peak days and hours will lead to a certain increase in your engagement.
Google Analytics
Most websites receive the major amount of their visits during the day when people are awake and have a predictably busy schedule during weekdays. You may see spikes in website traffic just before office or work time in the morning (7am to 9am), or at lunchtime (12pm to 2pm), or during office hours (4pm to 6pm).
So, before producing engaging content, you should know who your target audience is. One of the most common ways to do this is to conduct some reports.
- What Is Big Data Visualization? - January 22, 2021
- Five Benefits of Big Data Analytics for E-commerce - July 9, 2020
- Google Data Studio Vs. Tableau: Which One is More Suitable for Your Business? - June 25, 2020