Hey guys, today we going to learn about the “R” programming language. Before, discussing it I want you to check my previous blogs that will give you knowledge about some good technical concepts that we use in our programming world like Google captcha, Charts, Codeigniter etc. You will get the link of my previous blogs at the end of this blog. In this tutorial, we will learn the following topics as shown below:
- What and Why R?
- Variables in R
- Data operator
- Data Types
- Flow control statements
- Graphs in R
Jump to Section
What is R?
“R” is a computer programming language or you can say statistical programming language. Here we are using the word “statistical programming language”. Now, the first question that comes in our mind is “what is statistical programming language” and the answer is science of collecting and analysing numerical data in large quantity. So that we can easily plot the graphs based on that data. “R” is specifically used in “Analytics” or we can say “Data Analytics”.
In addition, we know that Analytics and Data Analytics is not known words to everyone that’s why we will also learn Analytics or Data Analytics.
Why R?
This is a good question that “why R” . “R” is easy to learn and code. Also, it is open source means freely available in the market. There are so many other languages available to use for doing statistical analysis. But in my point of view only “R” language is best for data analytics because it contains some good libraries for analytics than any other language. “R” handles the large quantity of numerical data for analysing very easily.
As we discuss that R is full of libraries for data analytics due to this we don’t have to write large codes. “R” is good for sentimental analysis. The sentimental analysis is the analysis based on sentiments like feelings of the writer, positive and negative reviews etc. Also, “R” is the most popular language for data visualization.
Variables In R
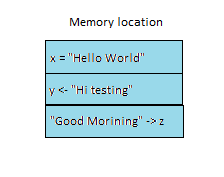
Variables are nothing but a reserved memory location to store the data values means when you create a variable, a space in memory is reserved for that variable. There are three methods for assigning the variable value as shown below.
# Here we assigning the string value to the x variable using equal sign. x = "Hello Word"
# Here we assigning the string value to the x variable using less than and hyphen symbol. y <- "Hi testing"
# Here we assigning the string value to the x variable using a hyphen and greater than symbol. "Good Morning" -> z
In above example, the pound sign is used for the comment that will not compile by the compiler.
In addition, we are showing here how memory is used by variables.
Data Operators
Data Operators are the operation that is performed on the operand. Operand are the variables that store the data value. There are basically five types of operators in “R” language. Below are the five data operators.
- Arithmetic operators
- Assignment operators
- Relational operators
- Logical operators
- Special operators
Arithmetic operators
These are the operators like addition, subtraction, multiplication and division. Below is the example of these operators.
-
# Addition
a <- 4
b <- 2
sum <- a + b
print(sum) # sum of "a" and "b" is "6"
-
# Subtraction
a <- 4
b <- 2
sub <- a - b
print(sub) # subtraction of "a" and "b" is 2
-
# Multiplication
a <- 4
b <- 2
mul <- a * b
print(mul) # multiplication of "a" and "b" is 8
-
# Division
a <- 4
b <- 2
div <- a / b
print(div) # division of "a" and "b" is 2
NOTE : If you don’t want to use print function to print the result of operation you can simply write the operation on the variable as shown below.
a + b # Gives the addition of the variables
a - b # Gives the subtraction of the variables
a * b # Gives the multiplication of the variables
a / b # Gives the division of the variables
Instead of the above five operators there are three more arithmetic operators as shown below.
# First operator
a <- 2
b <- 3
a ^ b # Result is 8 as the expression becomes a*a*a* means a to the power b

# Second operator
a <- 5
b <- 2
a %% b # Result is 1 as the expression gives the remainder of the division.

# Third operator
a <- 5
b <- 2
a %/% b # Result is 2 as the expression gives the quotient of the division with previous value means integer part.
# Pound sign is used to write comment.
Assignment operators
There are five types of assignment operators as shown below.
a = 3
a <- 3
3 -> a
a <<- 3
3 ->> a
# All above expression assigns the variable "a" with value 3.
# Pound sign is used to write comment.
Relational operators
To get the relation between the variables we use these operators and returns Boolean value. There are six types of relational operators as shown below.
a < b # Returns true if "a" is less than "b" otherwise gives false.
a > b # Returns true if "a" is greater than "b" otherwise gives false.
a == b # Returns true if "a" is equal to "b" otherwise gives false.
a != b # Returns true if "a" is not equal to "b" otherwise gives false.
a <= b # Returns true if "a" is less than or equal to "b" otherwise gives false.
a >= b # Returns true if "a" is greater than "b" otherwise gives false.
# Pound sign is used to write comment.
Logical operators
There are basically three types of logical operators as shown below.
a & b # Returns true if both variable is true.
a | b # Returns true if any variable is true.
! a # Returns true if variable is false and vice-versa.
# Pound sign is used to write comment.
Special operators
1 . “:” operator
It creates a range of values and stored in a variable as shown below.
a <- 1:9 # Return the range from 1 to 9
[1] 1 2 3 4 5 6 7 8 9 # Result
2. “% in %” operator
It is used to identify if an element belongs to a vector as shown below.
a <- 1:9 # Return the range from 1 to 9
[1] 1 2 3 4 5 6 7 8 9 # Result
5 %in% a # Returns true if 5 is exist in the variable "a".
Data Types
Data type gives the type of variable means it tells us that what type of value a variable stores.
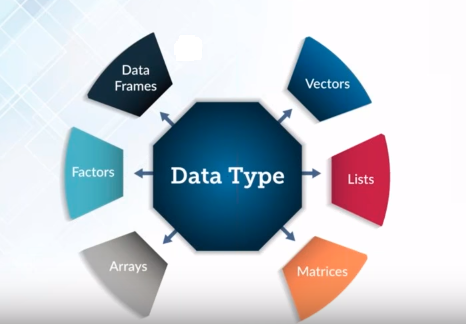
There are six types of data types as shown below.
- Vectors
- Lists
- Arrays
- Matrices
- Factors
- Data Frames
Vectors
Vector is a sequence or combination of data elements of the same type. It is further divided into five type or you can say classes of vectors. Vectors are defined by the special function as shown below.
a <- c(1,2,4,5,7,8)
# Here "a" is vector.
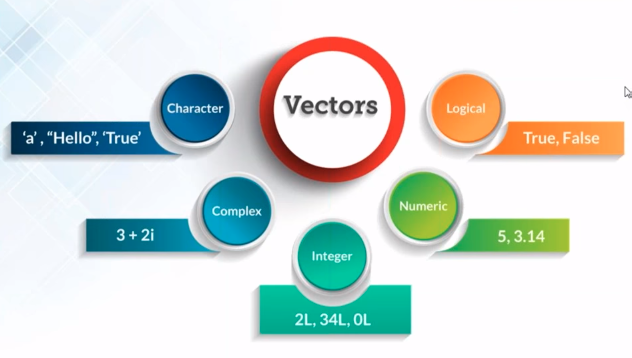
In above picture, vectors data type have five more data type as Character vectors, Complex vectors, Integer vectors, Numeric vectors and Logical vectors.
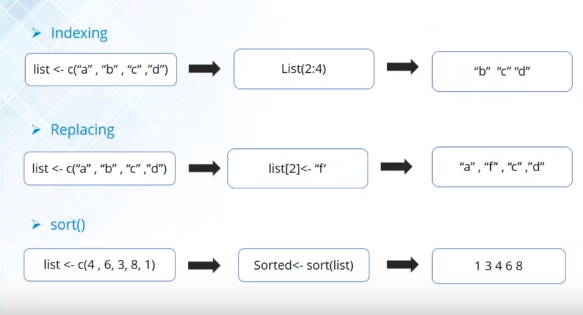
Sequence operation with vectors are : –
- Indexing
- Replacing
- Sorting
Below picture shows the operation performed with vectors.
Lists
Lists are the R objects that contain data of different types like numbers, strings, vectors and lists itself. Below is the example of lists.
a <- c(1,3,5,6,7) # Vector contains numeric value
b <- c("Hi","Hello","Good Morning","Car","Bike") # Vector contains string values
c <- list(a,b) # Variable contains list value.
d <- list(a,b,c) # List contains vectors as well as list also.
NOTE : class( ) function is used to determine the class of variable and typeof( ) function is used to find the type of data.
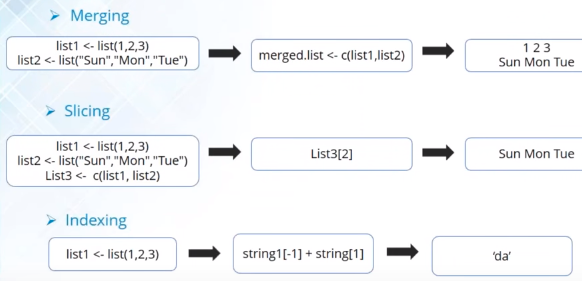
Sequence operation with Lists are : –
- Merging
- Slicing
- Indexing
NOTE : The only difference between vectors and lists is vectors stores data of only same type but lists stores data of different types. Also, lists helps the R objects to retain their original data types.
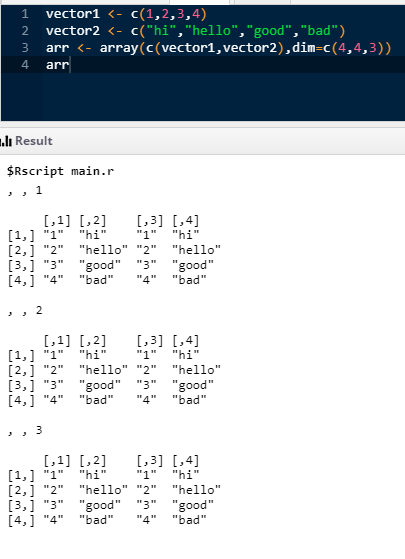
Arrays
Arrays can store data in more than two dimensions. It usually takes vectors as input parameters to create an array. Also, below is the example of how to create an array using vectors as an input element.
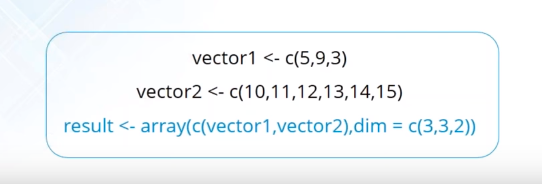
In above picture, array contains two vector input and one dimension input as shown below.
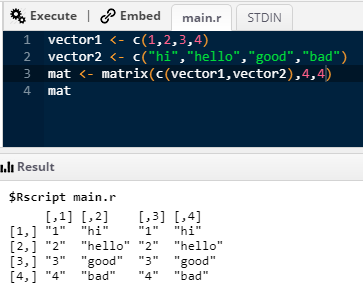
Matrices
Matrices are similar to the arrays but the only difference is that it is only two-dimensional rectangular layout. It is created by using matrix( ) function. Also, below is the syntax for creating a matrix.

In above picture, there are five parameters that is passed to matrix function. Also, below is the description of all the parameters.
data => It is the input vector that becomes the matrix element.
nrow => It is number of rows to be created.
ncol => It is number columns to be created.
byrow => It is logical value. If it is true then the vector element are arranged by row otherwise by columns.
dimnames => It is the names assigned to the rows and columns.
Factors
Factors are very useful in data analysis because it categorizes the data and stores it as levels. It can take the string as well as integers. It gives same values as one value. Also, below is the syntax for creating the factors.
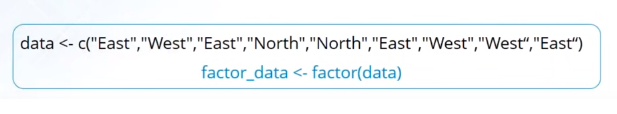
Example:
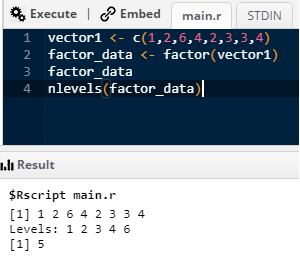
As you can see that we have used nlevels( ) function to print the number of levels.
Data Frames
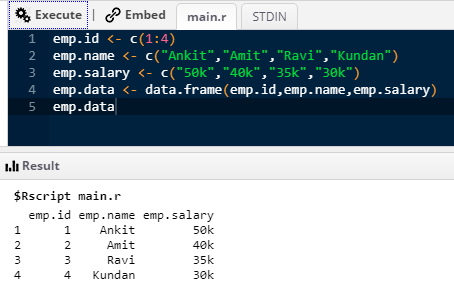
Data Frames is a two -dimensional array like structure in which each column contain values of one variable and each row contains one set of values of each column. The syntax for creating the Data Frames is shown below.
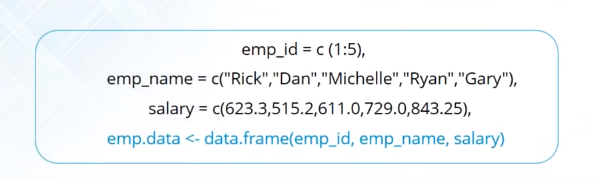
Example:
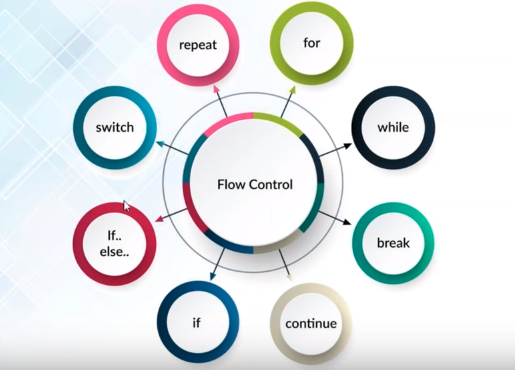
Flow Control Statements
In every programming language, flow control statements are available to divert and control the flow of a program. In R language there are eight types of flow control statements as shown below.
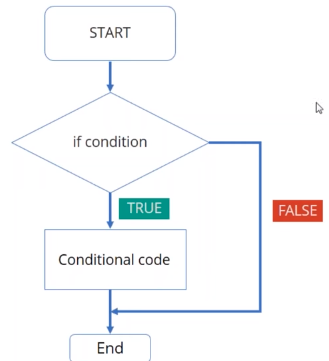
- “If” statement
If statement evaluates the single condition. The syntax for if statement is as shown below.
if (condition):
    statement
The flow chart is as follows :
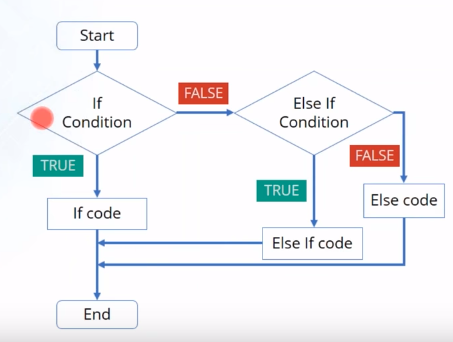
- “else if” statement
It evaluates the group of conditions and if the condition is met then the respective statement executes. Below is the syntax and the flowchart of else if statement.
if (condition):
    statement
else (condition1):
    statement
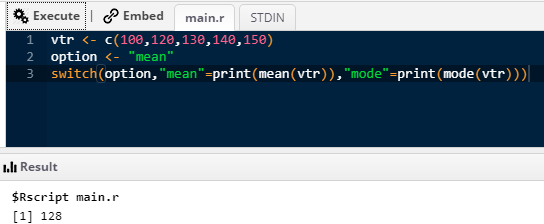
- “Switch” statement
The switch statement is used to compare the certain expression to known values. The syntax and flowchart is shown below.
switch( expression,value1,value2,value3,default value)
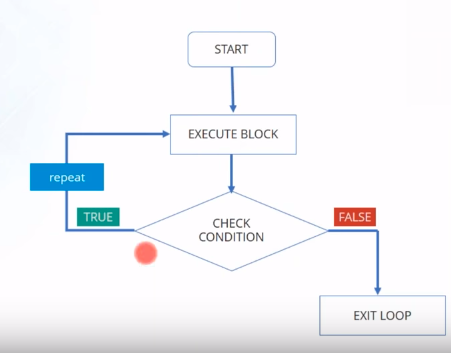
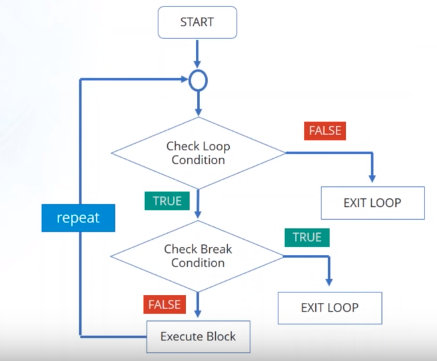
- “Repeat” statement
It executes loop until the loop condition is true. Below is the flowchart and syntax.
repeat{
      commands
      if(condition){
        break
       }
}
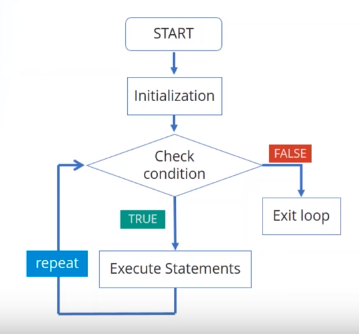
- “while” statement
It executes the statement till the condition is true. The syntax and the flowchart is shown below.
while(condition){
      statement
}

- “For” statement
For loop executes till the end of number. The syntax and the flowchart is shown below.
for(value in vector){
     statement
}
- “Break” statement
Break statement is used to get out of the loop. The flowchart is shown below.
- “next” statement
Next statement is similar to the continue statement in any other programming language.
Graphs in R
Graphs are the easiest way to show the bulk of data in the form of charts like pie chart, bar chart, scatter plot chart etc. R contains some good libraries of graphs like ggplot2 etc. I’m not going to describe the graphs here. For deep knowledge of graphs in R, you can check the link as shown below.
https://www.loginworks.com/blogs/how-to-create-graphs-using-ggplot-library-in-r/
Conclusion
In this tutorial, we have learned all the basic concepts of R language like a variable in R, Data types, operators etc. If you have any query regarding any topic in R then please comment in the comment section. As I mentioned my previous blogs in the starting of this tutorial for that I’m going to mention the link here as follows.
- Create help desk using Zendesk.
- Scatter plot chart and polar chart using JavaScript.
- Integrate google captcha with Php.
- login, signup and user listing in Codeigniter.
I excel when it comes to making bespoke data dashboards and visualizations that users and clients absolutely love. Sharing about things I enjoy doing is my hobby, whether it's about a project, collaboration, feedback, or just simple how-to guides about visualization.
If you have something to ask or share, I'd love to hear from you!
- Business Intelligence Vs Data Analytics: What’s the Difference? - December 10, 2020
- Effective Ways Data Analytics Helps Improve Business Growth - July 28, 2020
- How the Automotive Industry is Benefitting From Web Scraping - July 23, 2020
Thanks on your marvelous posting! I seriously enjoyed reading it, you could be
a great author. I will be sure to bookmark your blog and will often come back down the road.
I want to encourage continue your great job
GOOD POST
Excellent site you’ve got here.. It’s difficult to find quality writing
like yours nowadays. I truly appreciate people like you!
Take care!!
When someone writes an paragraph he/she retains the image of a user in his/her mind that how a user can understand it. Thus that’s why this article is perfect. Thanks!|
Awesome! Its genuinely awesome post, I have got much clear idea concerning from this paragraph.|
Hi there to every single one, it’s really a fastidious for me to pay a visit this web page, it includes useful Information.|
Fine way of describing, and pleasant article to get data about my presentation subject, which I am going to convey in university.|
This is the right blog for everyone who wishes to understand this topic. You know a whole lot its almost hard to argue with you (not that I personally would want to…HaHa). You certainly put a brand new spin on a subject which has been written about for years. Wonderful stuff, just excellent!|
Hi there! Would you mind if I share your blog with my facebook group? There’s a lot of people that I think would really enjoy your content. Please let me know. Many thanks|
I am not sure where you are getting your info, but great topic. I needs to spend some time learning more or understanding more. Thanks for magnificent information I was looking for this info for my mission.|
Hi there, I enjoy reading through your article. I wanted to write a little comment to support you.|
This page certainly has all of the information I needed about this subject and didn’t know who to ask. |
Very nice article, totally what I was looking for.|