The version of Power BI desktop or latest update in power BI services has come out with the new features like web URL connector specifically designed for web scraping. It is open source software and secured also. It works fast and easy to use for scraping data from the website. It works in two phases like basic level and advanced level. In this blog, we will try to describe how we can take advantage of it.
Let’s discuss the following points one by one:
1. What is web scraping
2. Connect web URL data source
3. Get web URL data from the source
4. Manipulate data in power query editor
5. Create the report
6. Customize the report
Jump to Section
What is web scraping?
Web scraping is a data scraping used for extracting data from web source. It is in the form of row and column that is scraped from web source. Web extracting or web harvesting is essential for gathering a large amount of data from web source where the dataset is available on the local machine
Connect web URL data source
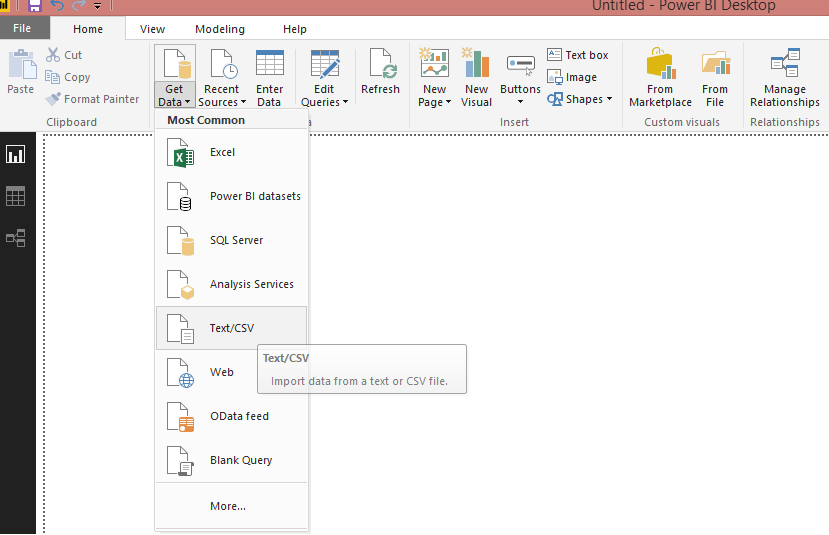
You can connect to power BI from web URL. Go to power BI desktop and select get data and click on web field.
Get web URL data from the source
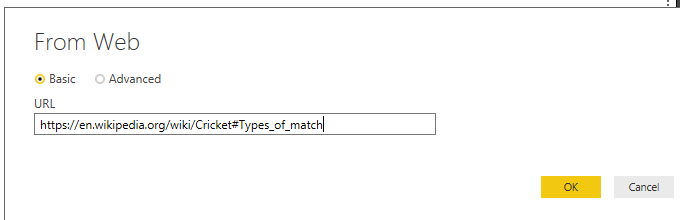
Now let’s take an example i.e web URL is: https://en.wikipedia.org/wiki/Cricket#Types_of_match
In the web dialog box, paste the URL https://en.wikipedia.org/wiki/Cricket#Types_of_match in the URL text box and then select OK.
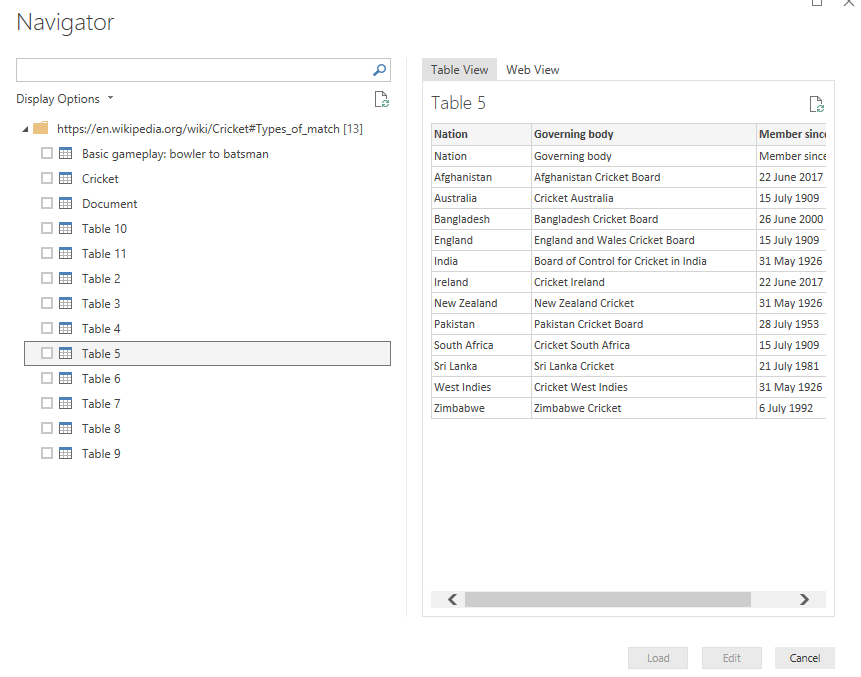
After you click on OK button, data will download in multiple tables that is available in web source and when connecting this Wikipedia web page, the Power BI navigator dialog box shows the list on multiple tables on the page. If you select any one table then you can preview its dataset. You can reshape and clean up the dataset before loading it into Power BI. After that, select all the tables into the data window and load the data. Now, these datasets will be loaded into Power BI. You can manipulate data i.e data cleaning and transformation using Power Query. A preview of the sheet opens in the power query editor where you can apply the manipulation of data.
Manipulate data in Power query editor
If you want to make the data easy to understand, easy to use for creating the power BI report, go to edit query and select any table to perform these steps.
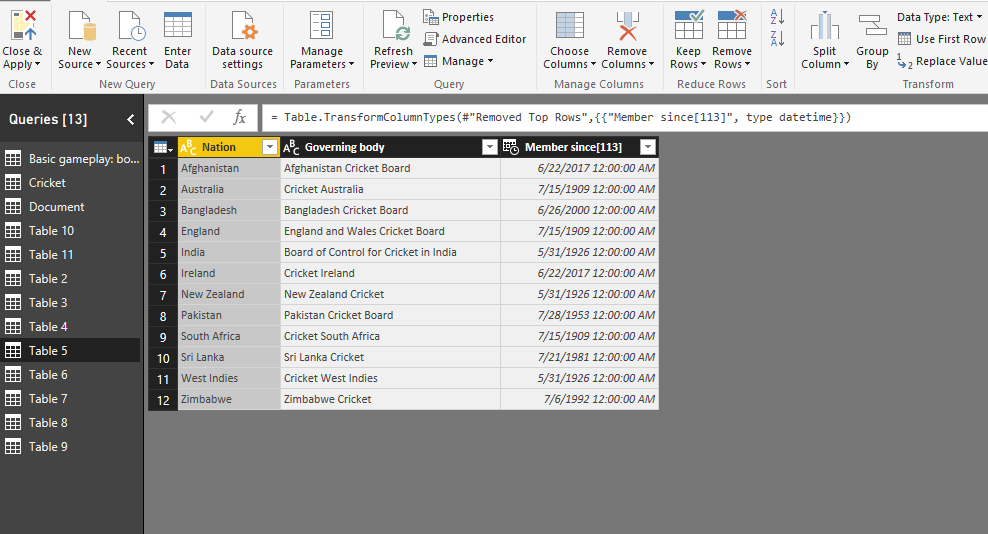
In this table first row is an incorrect form, so we can remove this. Go to remove row > remove top row and set the number of rows in the dialog box and click on ok. If you right click at any column name then it shows the properties of power BI editor. If you want to change the data type of any column like the last column is a member since it is in character form and you want to change it into Date/Time. You can change require data type from column data type.
When you right click on the column, it has many properties such as transform, remove change type, split column, replace value, replace error, rename, move, group by and duplicate column etc. Using these properties, you can perform any step in power query. From this tab, you can apply ascending and descending order. When you perform the required steps then select close and apply, it will be saved into power Bi desktop.
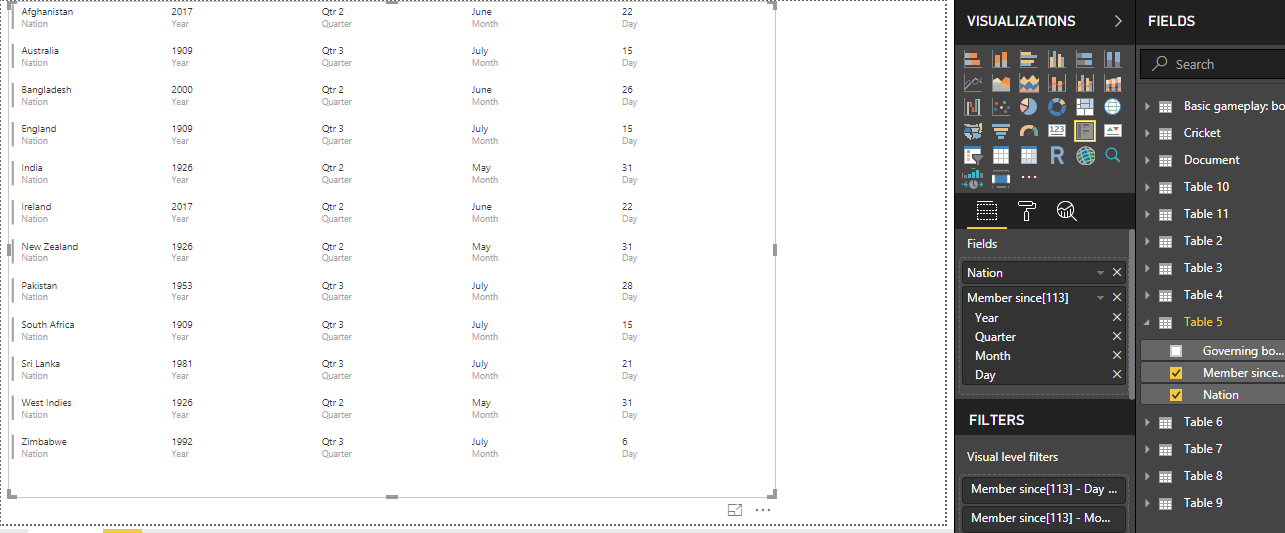
Create the report
Now, you can select any visual report of a particular dataset. Then select the table 5 and select multi-card and drag nation, member science column into multi-card. You will get a graph like:
Customize the report
Whenever you need to update the report, you can customize according to the requirement. You can create another graph on the same data and can format the report. You can import new chart also from FROM MARKETPLACE fields. When you import many tabless then you need to manage the relationship between all the tables. Here, we select the manage relation tab and create the relation between two or more table. When you want to create other graphs like time series, search, histogram chart, Power KPI, Venn diagram, funnel plot etc. then you can download them from Power BI Visual. Click on MARKETPLACE and search any plot in the search box then click on Add, after that you get the import custom visual message box. Now, you can create a new plot from it. It is very helpful for creating a new type of graph.
Conclusion
In this blog, I have explained how to scrape data from web source using Power BI. I described all the steps including how to scrape basic level and advanced level from web URL. If you scrape data from source using power BI then you can create a visual report also and can modify it according to your requirement. It is very easy to scrape data from the website and create the visual report in minimum time. Moreover, it works very fast, execution time complexity is low and it can be used for a large amount of data.
I excel when it comes to making bespoke data dashboards and visualizations that users and clients absolutely love. Sharing about things I enjoy doing is my hobby, whether it's about a project, collaboration, feedback, or just simple how-to guides about visualization.
If you have something to ask or share, I'd love to hear from you!
- Business Intelligence Vs Data Analytics: What’s the Difference? - December 10, 2020
- Effective Ways Data Analytics Helps Improve Business Growth - July 28, 2020
- How the Automotive Industry is Benefitting From Web Scraping - July 23, 2020