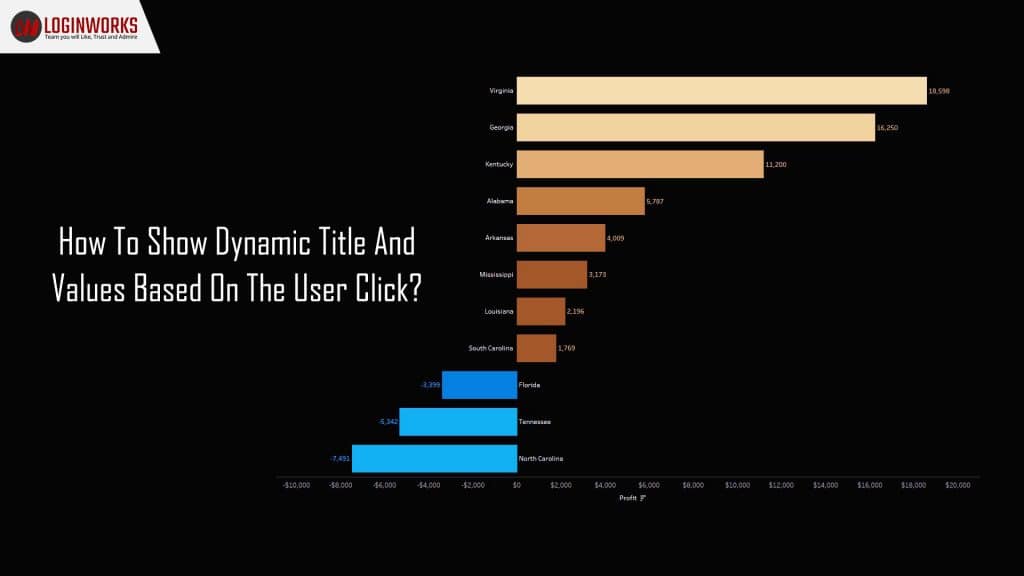
Hey guys, hope you are doing well. I’m back with the new concept of Power BI. Today’s topic is very important and interesting because these concepts are the base of any good report. Everyone wants to show their data dynamically without writing hard-coded values. The reason behind dynamic values is that, if someone has generated the power BI report and wants to change the title of the report (Page) based on the content or filter then one can do that. But if the value is hard-coded then it is not possible to do that. As a viewer, we only understand what we see. So, if the presenter clicks the check-box for filtering the data and at that time if the title is not changing then it is a little bit confusing that what data is showing for. In addition, it is best practice to use a dynamic title. Let’s start implementing this concept.
Jump to Section
How to create a report?
For creating dynamic title and value first, we are going to create a report and then apply drill-through in that report. Here, we are taking the superstore data for creating the report. Data contains orders, people, product profit and returns etc.
Below is the screenshot of how to import data-set.
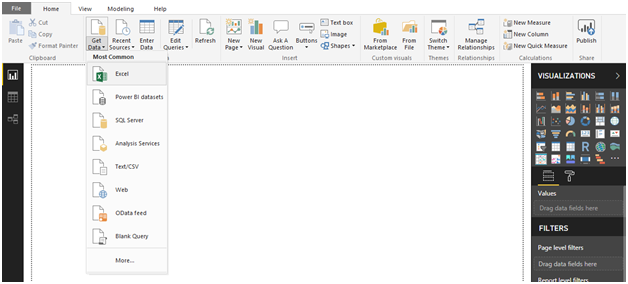
In the picture, you can see the options for importing the dataset. Here, we will use Excel files for data. In the next picture, we have already created a report based on the data imported in the previous step.
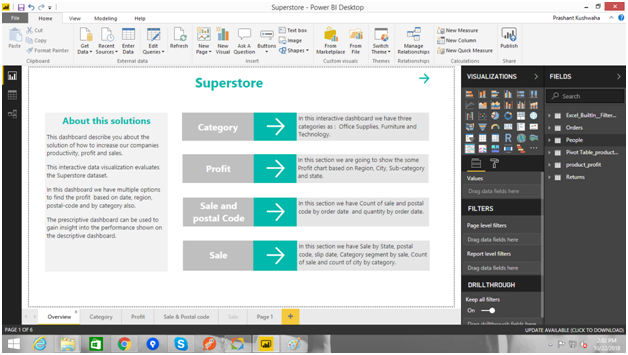
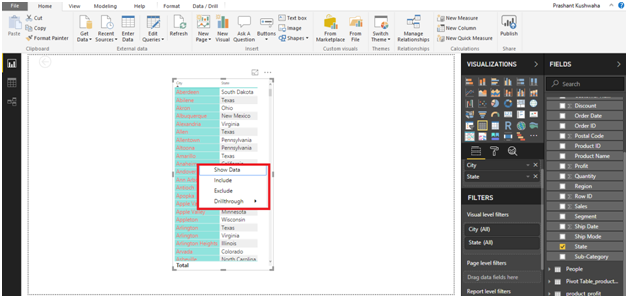
The above picture describes the categories that will use in this report. We will use drill through filter to filter the particular value from the table and based on that value we will change the title and the value of that page or report. Below is the screenshot where we will use drill-through filter.

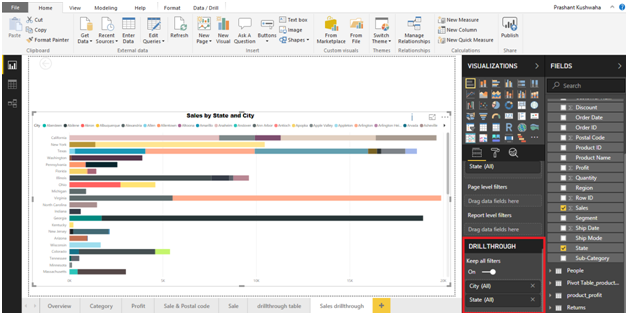
The highlighted portion in the above picture shows the drill-through filter option where we can add the column on which we want to filter the data. Here, we are using city and state column from the order table based on these columns we filter the sales data according to the city and state.
Using drill-through
Once you have added the columns in the drill-through filter area then you can easily see the drill-through option when you right-click on any table. Drill-through option shows all the pages in which you have used the drill-through filter. So, that you can select any of them to apply the filter. Below are the steps of applying the drill-through filter in your report.
1. Add or drag the column on which you want to apply the filter in the drill-through filter area.
2. Right-click on any table column. When you click on the column data you can see the pop-up as shown below. The highlighted area shows the pop-up.
3. Hover on drill-through option as shown in the previous step. Select page ( Report ) on which you want to apply the drill-through filter. Below is the screenshot of the same.
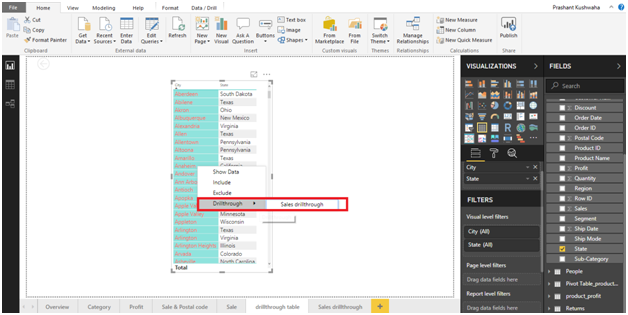
In the above picture, you can see the highlighted area that shows the available pages (Report) to apply the filter.
4. Once you click on the page (Report) you will be auto-redirected to that page. Below is the screenshot of the same.
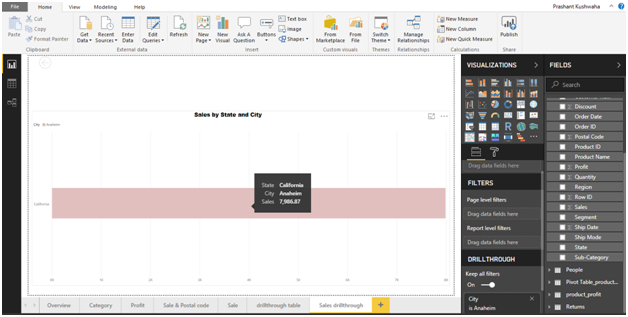
In the previous step once you select the page (Report) then you can see the report page as I had in this step. Here the sales data is filtered according to the city and state. Selected from the table in the above step.
Creating dynamic title and values
Dynamic value means data changes based on user click. In this case, here we are going to create a new measure and write some DAX code. Below are the steps for creating dynamic title and values based on the user click.
1. Create a measure that uses the field supplied in the drill-through filter by using the DAX formula as shown below.
<New measure name>=IF(HASONEVALUE'<column name>'[<field nae>]), VALUES(‘<column name>'[<filed name>]),”<default name>”)
The initial segment of this formula verifies whether one esteem is chosen inside the predefined field. On the off chance that there is just a single esteem, at that point, it shows that esteem, else it shows a default esteem.
For the report implanted in this post, mine resembles this:
2. Now, let’s take the card to show the title using this drill-through filter as shown below.

In the above picture, you can see the highlighted area here I’m selecting Chicago city based on this, the title of the next page will be changed and values also.
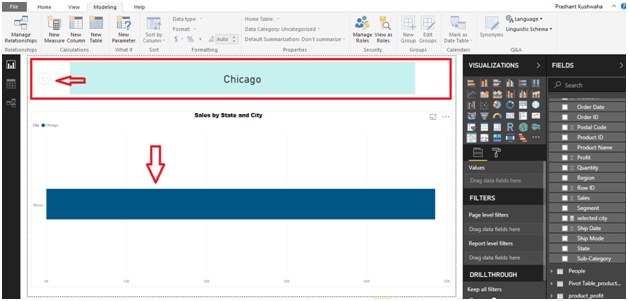
In the above picture, the title comes from the table value selected in the previous step. In this whole process, the back button added automatically in the report.
A dynamic title takes just a couple of minutes to execute and gives a huge incentive to clients. This technique can be adjusted for use in reports that have bookmarks, or to show slicer determinations, as well. It can take a Power BI answer to that next level of enormity by making client encounter the best need.
Conclusion
We have so many questions from our users or friends that why are you writing blogs on only power BI topics and my answer is because of its usability and having great features for creating reports and also easy to use. In this article, I have described How to show dynamic title and values based on user click and visual header with updated styling that will improve your report’s readability. As I have already discussed Power BI topics in my previous article that’s why I did not discuss in deep about Power BI. I hope you have understood the concept of dynamic title and values based on user click and visual header with updated styling. Thanks!
I excel when it comes to making bespoke data dashboards and visualizations that users and clients absolutely love. Sharing about things I enjoy doing is my hobby, whether it's about a project, collaboration, feedback, or just simple how-to guides about visualization.
If you have something to ask or share, I'd love to hear from you!
- Business Intelligence Vs Data Analytics: What’s the Difference? - December 10, 2020
- Effective Ways Data Analytics Helps Improve Business Growth - July 28, 2020
- How the Automotive Industry is Benefitting From Web Scraping - July 23, 2020