
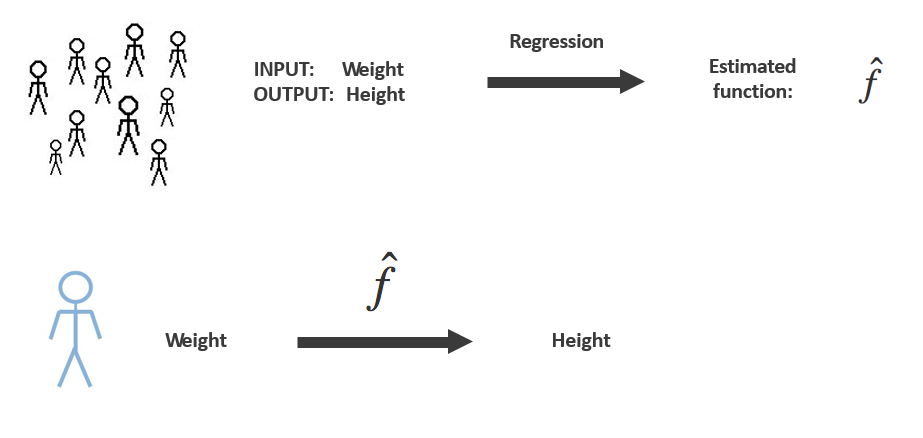
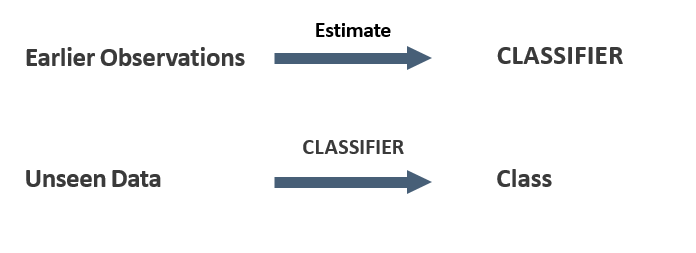
Identify a machine learning problem
Use basic machine learning techniques
Think about your data/results
Machine learning is a part of data science that deals with programming the computer in such a way that it automatically learn and grow with experience. It means recognition and understanding the input dataset. It caters to all the decisions based on all possible inputs.
To fix this problem, some algorithms are developed with R programming. These algorithms build knowledge from specific data and statistical analysis, probability theory, logic, combinatoric optimization, search, reinforcement learning, and Data control.
The developed algorithms form the basis of R programming such as:
- Regression Model
- Decision Tree
- Classification
- Cluster
- K-Nearest Neighbors
Jump to Section
Regression Model:
It is a Statistical approach to find the relationship between two or more variable. It is part of supervise learning. It maintains the relationship between dependent and independent variable. It is used to build regression model with a minimum square error of the fitted value.
Types of Regression model
Simple Linear Regression: It has two main objectives stating establishment between two variables. Ex: Income and spending, Higher income will spend more.
Multiple Linear Regression: It maintains the relationship between one or more predictor variables.
Non-Linear Regression: It maintains the relationship between predictor and response variable.
Example: Simple Linear Regression
y = ax + b
Where
y is the response variable.
x is the predictor variable.
a and b are constants which are called the coefficients.
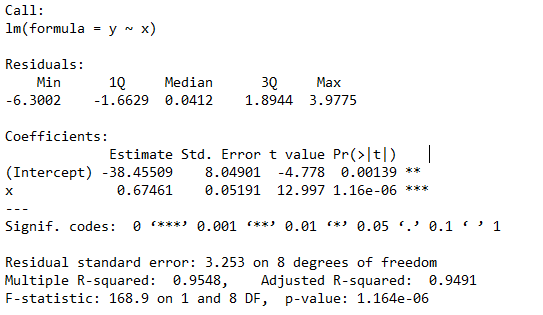
# Value in Height
x = c(151, 174, 138, 186, 128, 136, 179, 163, 152, 131)
# Value in Weight
y = c(63, 81, 56, 91, 47, 57, 76, 72, 62, 48)
SLRModel = lm(y~x)
print(SLRModel)
Call:
lm(formula = y ~ x)
Coefficients:
(Intercept) x
-38.4551 0.6746
print(summary(SLRModel))
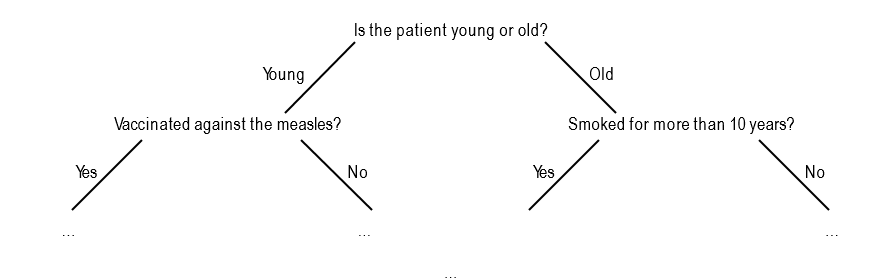
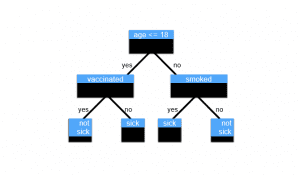
Decision Tree:
It occurs in the Classification problem. It works for both like categorical and continuous input and output variables.
Tasks of classification:
- Automatically assign a class to observations with features.
- Observation: vector of features, with a class.
- Automatically assign a class to new observation with features, using previous observations.
- Binary classification: two classes.
- Multiclass classification: more than two classes.
Example
A dataset consisting of persons
Features: age, weight and income
Class: happy or not happy
Multiclass: happy, satisfied or not happy
The decision tree Example
Suppose you’re classifying patients as sick or not sick.
Classification:
It is the statistical problem of identifying a set of categories in a new observation, on the basis of a training group of data containing observations (or instances) which is category membership is known.
Classification Problem
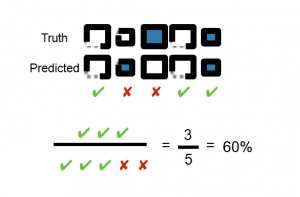
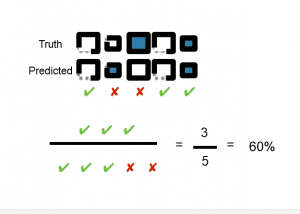
Accuracy and Error
System is right or wrong
Accuracy goes up when Error goes down
Accuracy = correctly classified instances/total amount of classified instances
Error = 1 – Accuracy
Example:
Squares with 2 features: small/big and solid/dotted
Label: colored/not colored
Binary classification problem
Limits of accuracy
- Classifying very rare heart disease
- Classify all as negative (not sick)
- Predict 99 correct (not sick) and miss
- 1 Accuracy: 99%
- Bogus… you miss every positive case!
Goal: predict category of new observation
Classification Applications
Medical Diagnosis:- Sick and Not Sick
Animal Recognition:- Dog, Cat and Horse
Important: Qualitative Output, Predefined Classes
Cluster:
Clustering is a technique to club a set of objects in such a way that the objects in the same group (called a cluster) are more similar (in some sense or another) to each other than to that is in other groups (clusters).
It is the main task to analyze data, and a common technique for statistical data analysis, used in many fields, including machine learning, pattern recognition, image analysis, information retrieval, bio-informatics, data compression, data mining and system graphics.
It is the step of dividing the data points into a number of sets such that data points in the same sets are more similar to other data points in the same group than those in other sets. In simple words, the part is to segregate sets with similar traits and assign them into clusters.
There are the following cluster properties:
- Grouping objects in clusters
- Collection of objects
- Similar within cluster
- Dissimilar between clusters
- Grouping objects in clusters
- No labels: unsupervised
- Classification Plenty possible clusterings
- Similar within cluster
- Dissimilar between clusters
Example:
Grouping similar animal photos
No label information
Need distance metric between points
No right or wrong
Plenty possible clusterings
Performance measure consists of 2 elements
Similarity within each cluster (Bottom to up)
Similarity between clusters ( Top to bottom)
K-Nearest Neighbors:
K-Nearest neighbor is an algorithm that stores all available cases and classifies new cases by a large number of votes of its k neighbors. This algorithm apartheid unlabeled data points into well-defined sets.
K-nearest neighbor algorithm adds to its basic algorithm that after the distance of the new point to all stored data points has been calculated, the distance values are sorted and the K-nearest neighbors are determined. The labels of these neighbors are gathered and a majority vote or weighted vote is used for classification or regression purposes.
- No real model like decision tree
- Compare unseen instances to training set
- Predict using the comparison of unseen data and the
- training set
Form of instance-based learning
Simplest form: 1-Nearest Neighbor or Nearest Neighbor
Example:
2 features: X1 and X2
Class: red or blue
Binary classification
Save complete training set
Given: unseen observation with features X = (1.3, -2)
Compare training set with new observation
Find closest observation — nearest neighbor — and assign same class
just Euclidean distance, nothing fancy
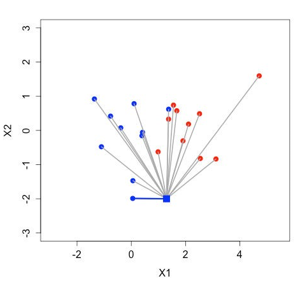
k is the amount of neighbors If k = 5
Use 5 most similar observations (neighbors)
Assigned class will be the most represented class within the 5 neighbors.
Summary
Machine learning is taking over the world-wide. These are the basic algorithm in machine learning. It is a growing need between organizations for professionals to know the inputs and outputs of machine learning.
These algorithms help to statistical problems using concepts like regression, clustering, classification, and prediction. These are mainly used for predictions, classification and verification basic of the continuous or categorical dataset.
It should be useful to everyone from business executives to ML practitioners. It covers virtually all aspects of machine learning (and many related fields) at a high level and should serve as a sufficient introduction or reference to the terminology, concepts, tools, considerations, and techniques in the field.
- Difference Between SQL and MySQL - April 14, 2020
- How to work with Subquery in Data Mining - March 23, 2018
- How to use browser features of Javascript? - March 9, 2018
Nice blog about Machine Learning as well as R programming