In this article, I am going to describe how to export the data from visualizations in Power BI. First, let’s understand what is importing and exporting of data. It’s a complete cyclic process. Importing the data in Power BI means to get the data into your Power BI desktop and based on that you create different types of visualizations and add into your report. Exporting the data means sending the data from visualizations and insert in other reports i.e .xlsx, .doc file, and .csv file. We are going to discuss both the techniques but here, we are focusing mainly on exporting the data from different visuals. Let’s discuss both the techniques one by one starting with importing the data.
Jump to Section
Importing the Data in Power BI desktop
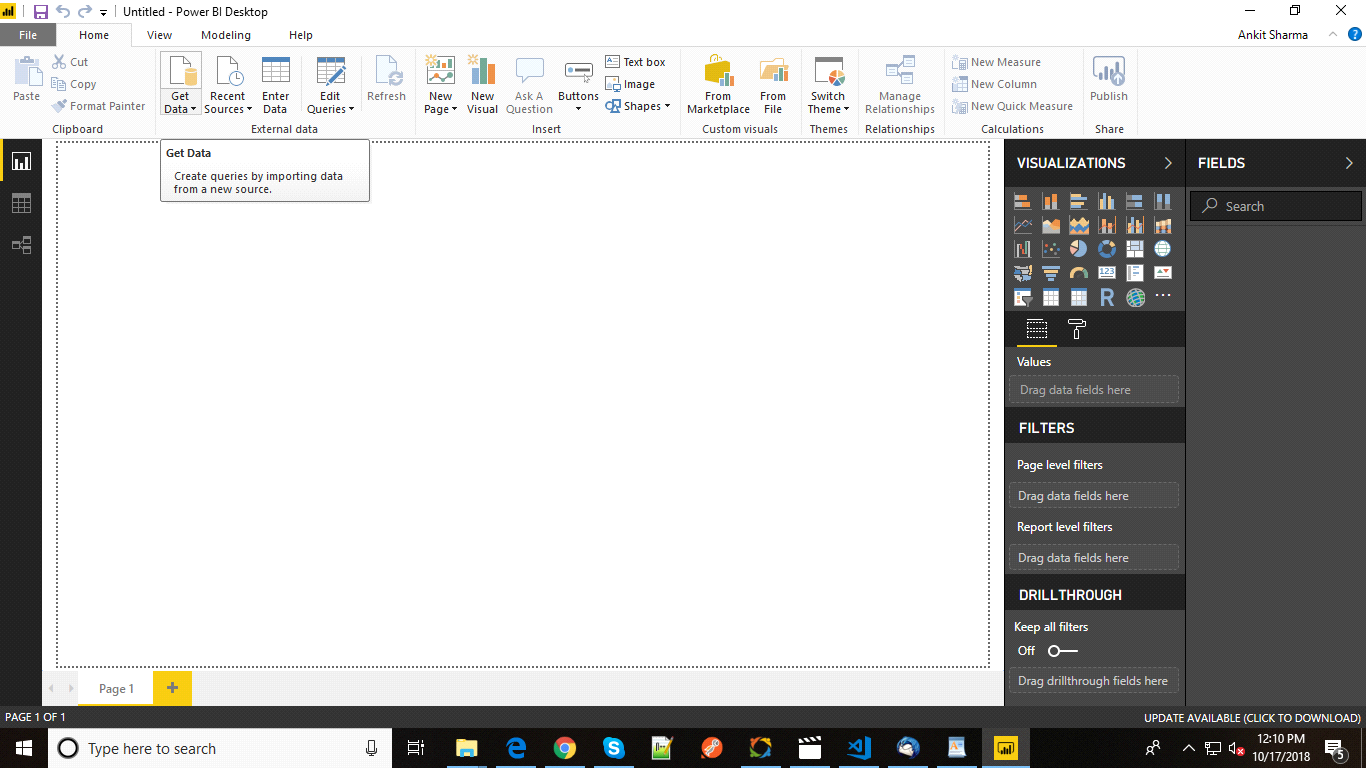
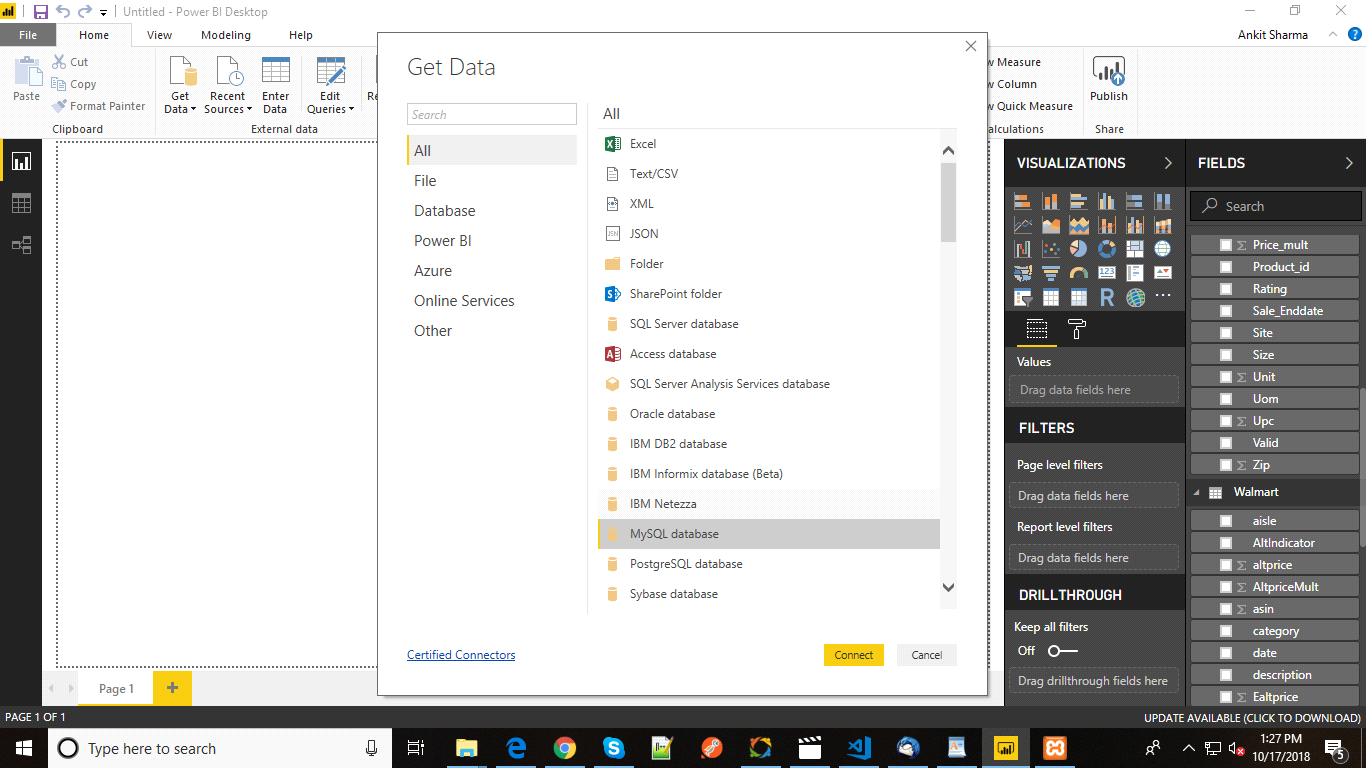
1. To import data into the Power BI desktop, you first need to open your Power BI desktop application and click on Get Data.
2. You can then choose the connector based on your data. It can be your MySQL database, an excel sheet or an ODATA feed. In this application, we are using an excel sheet. So choose excel and click on connect.
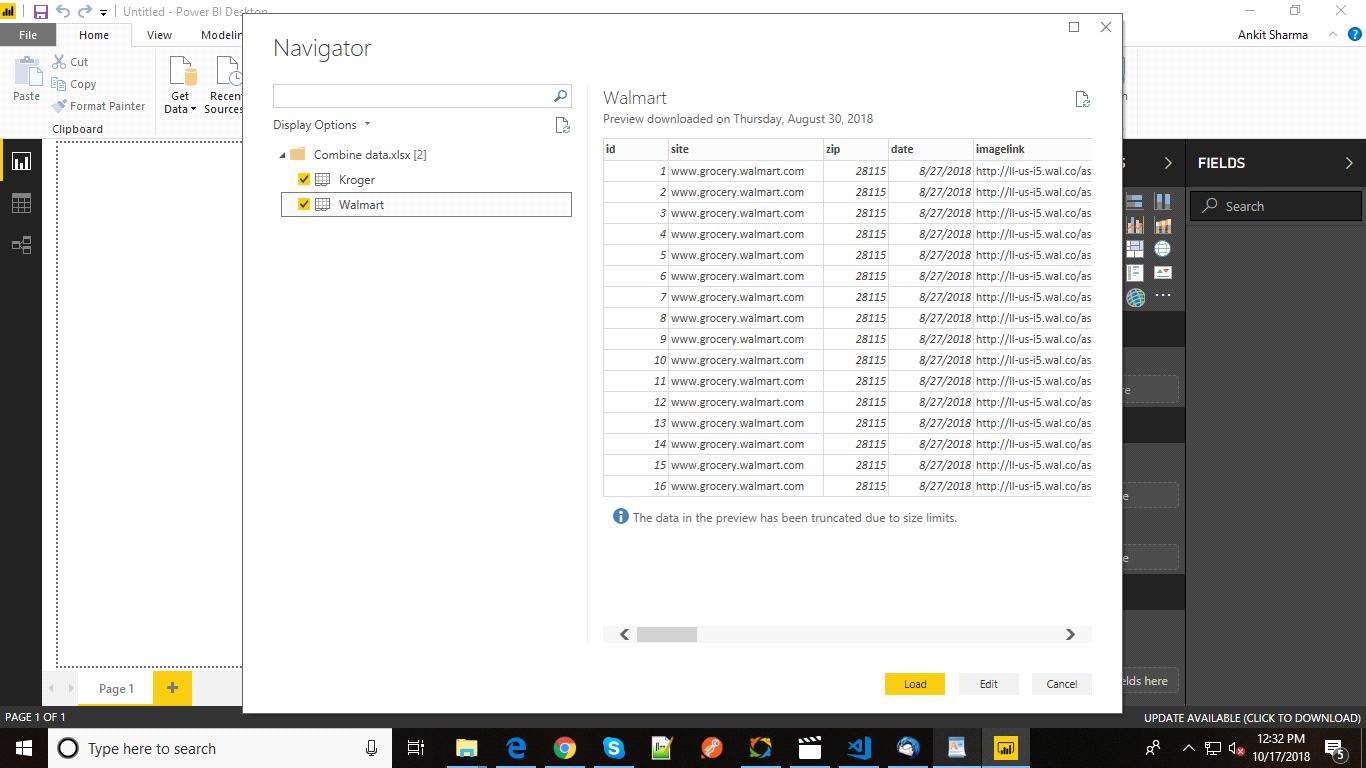
3. Now you need to choose the excel file from your local machine and it will open a Navigator page which will show all the sheets present in your excel file. You need to select those which you want to import. In our case, it looks like this.
4. Click on Load or you can edit the data too before loading. In Edit mode, it will open Power Query editor where you can clean the data or add other column if you needed in your data.
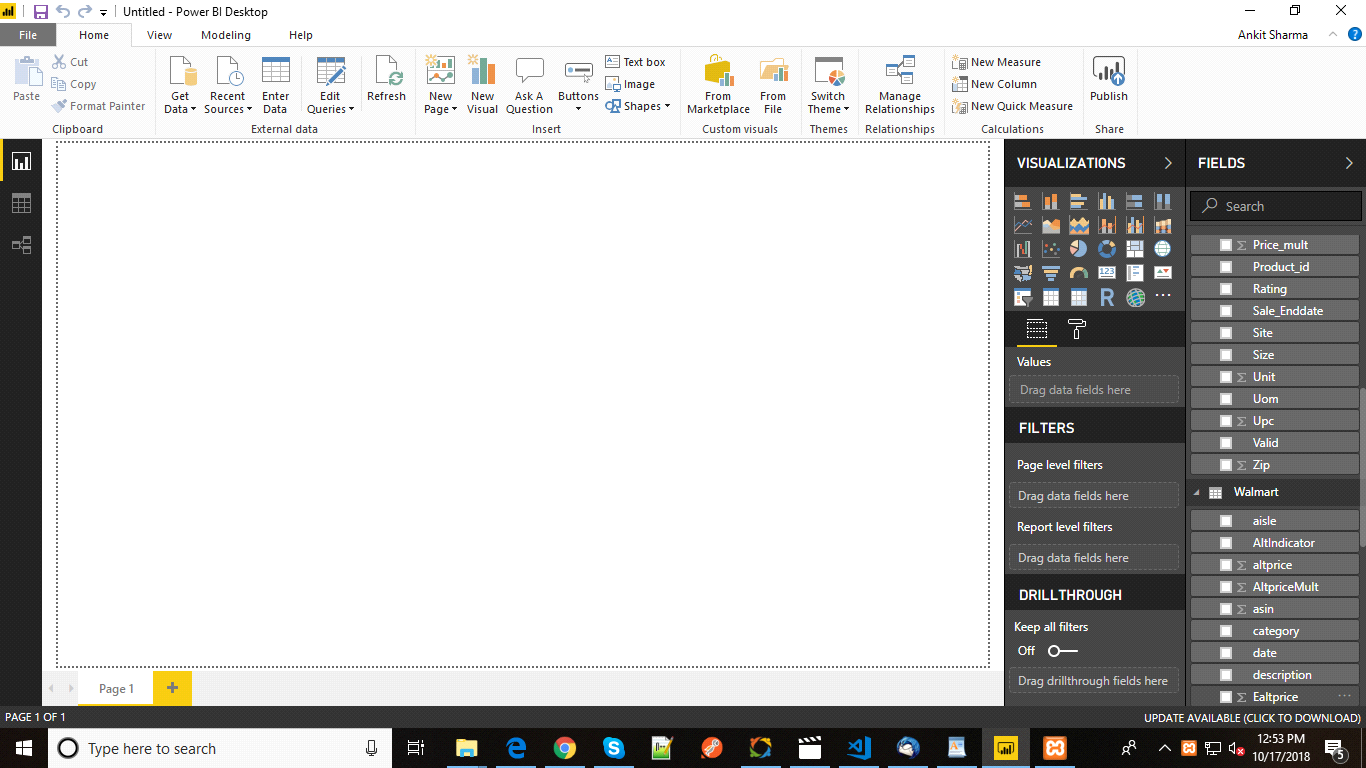
5. After editing, you need to click on close and apply and load the data into the application. It will take some time. After importing, you will see all the columns of your files are showing in the Fields section.
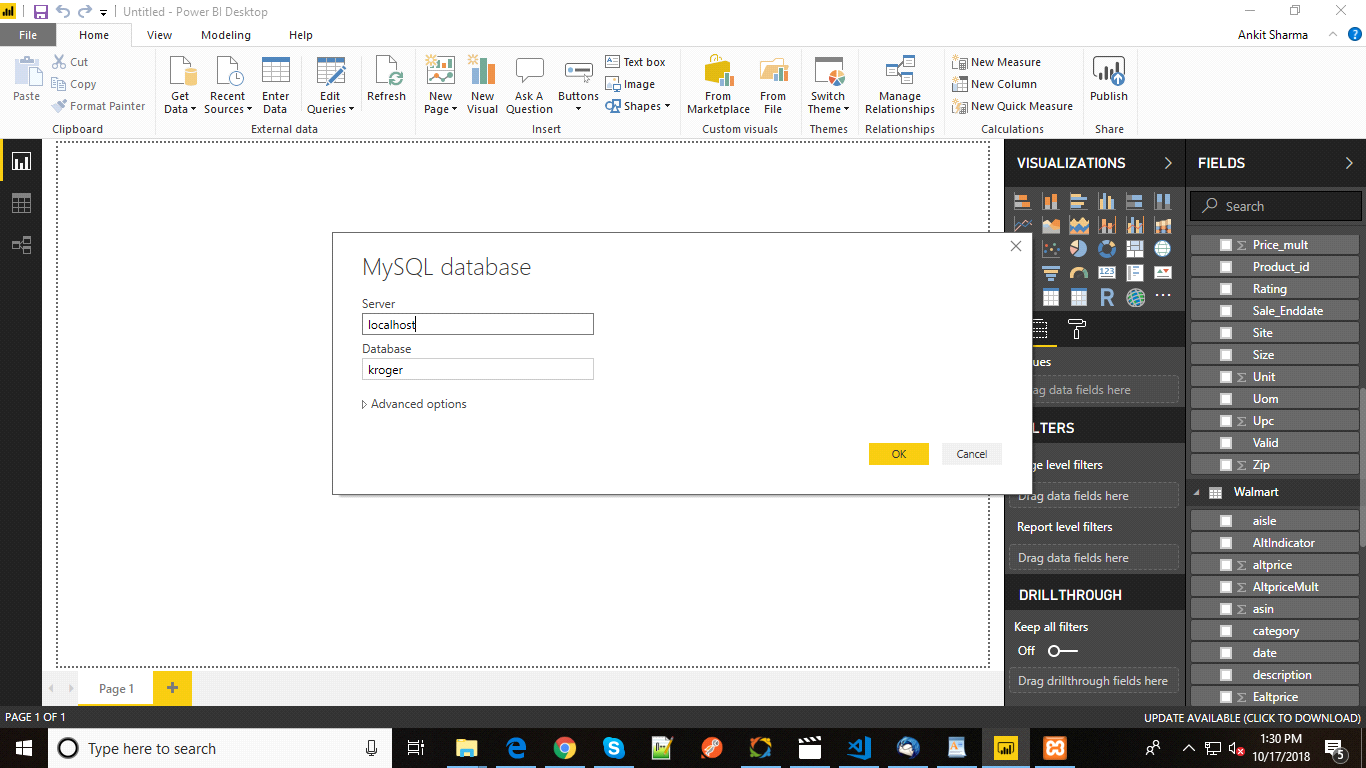
6. You can import the data from MySQL database too by clicking MySQL Database and click Connect. It will open a new window in which you need to enter the server and database name. In my case, it is localhost and database name is Kroger.
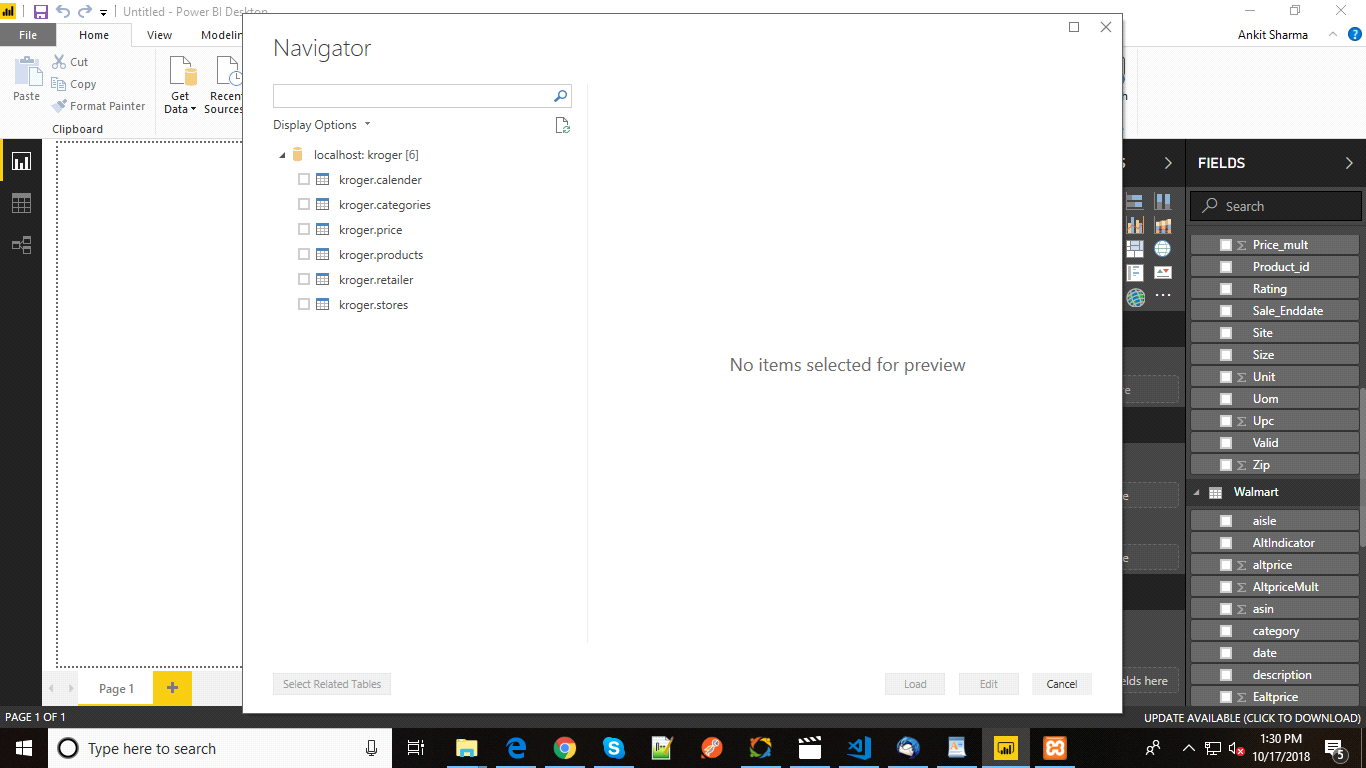
7. It will show you all the tables present in the database which look like this (Please see the image below). Now we need to select the visuals which we want to import in our Power BI desktop application.
Now importing the data is done. We will move to the next part i.e. exporting the data from visuals.
Exporting the data from visualization in a file
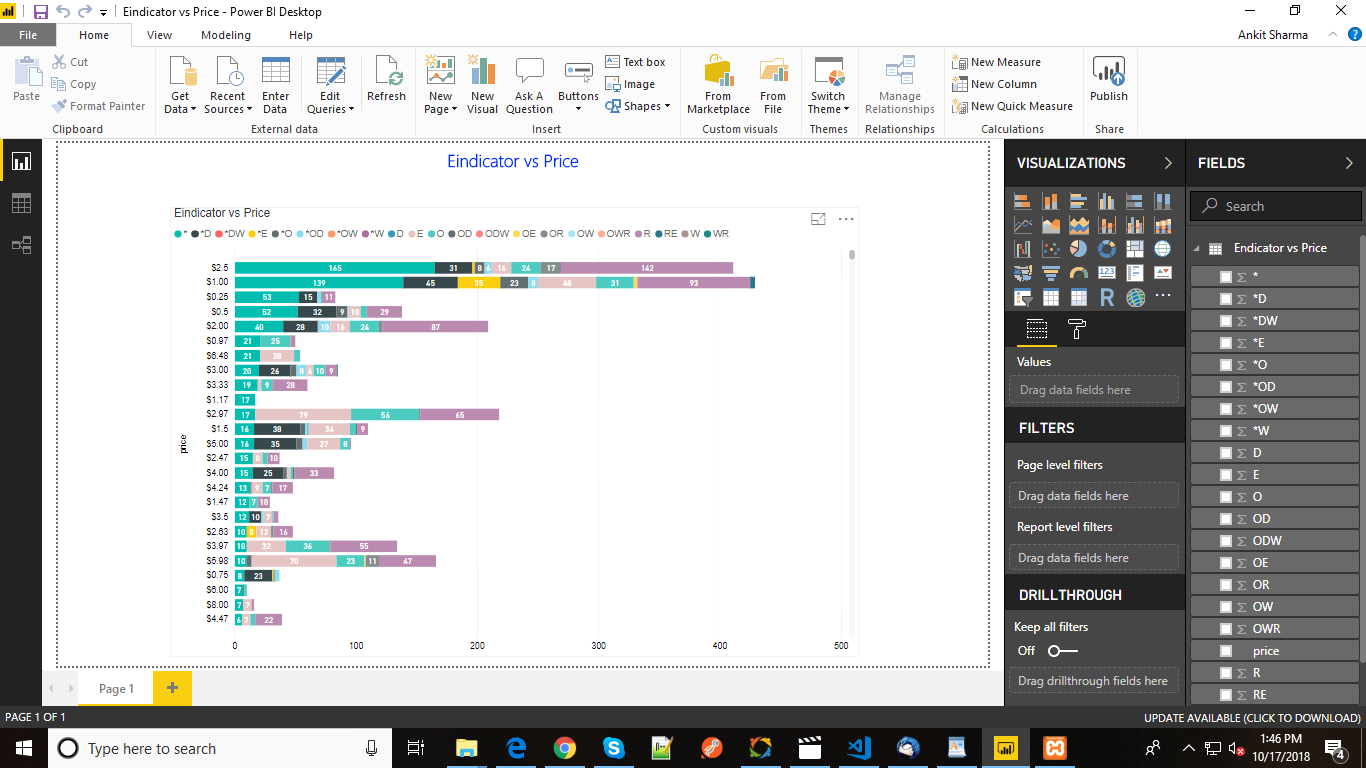
Exporting the data means to export the data from visuals in other medium like in other Power BI dashboard or in a csv file. In this section, we are going to learn the same. For this demo, I am going to use an Indicator .pixy file which is present in my local machine. You can use any .pixy file. The report looks like this on my desktop.
Follow these instructions as listed below.
1. Click on ellipses (three dots) present on the top right corner of the visualization area.
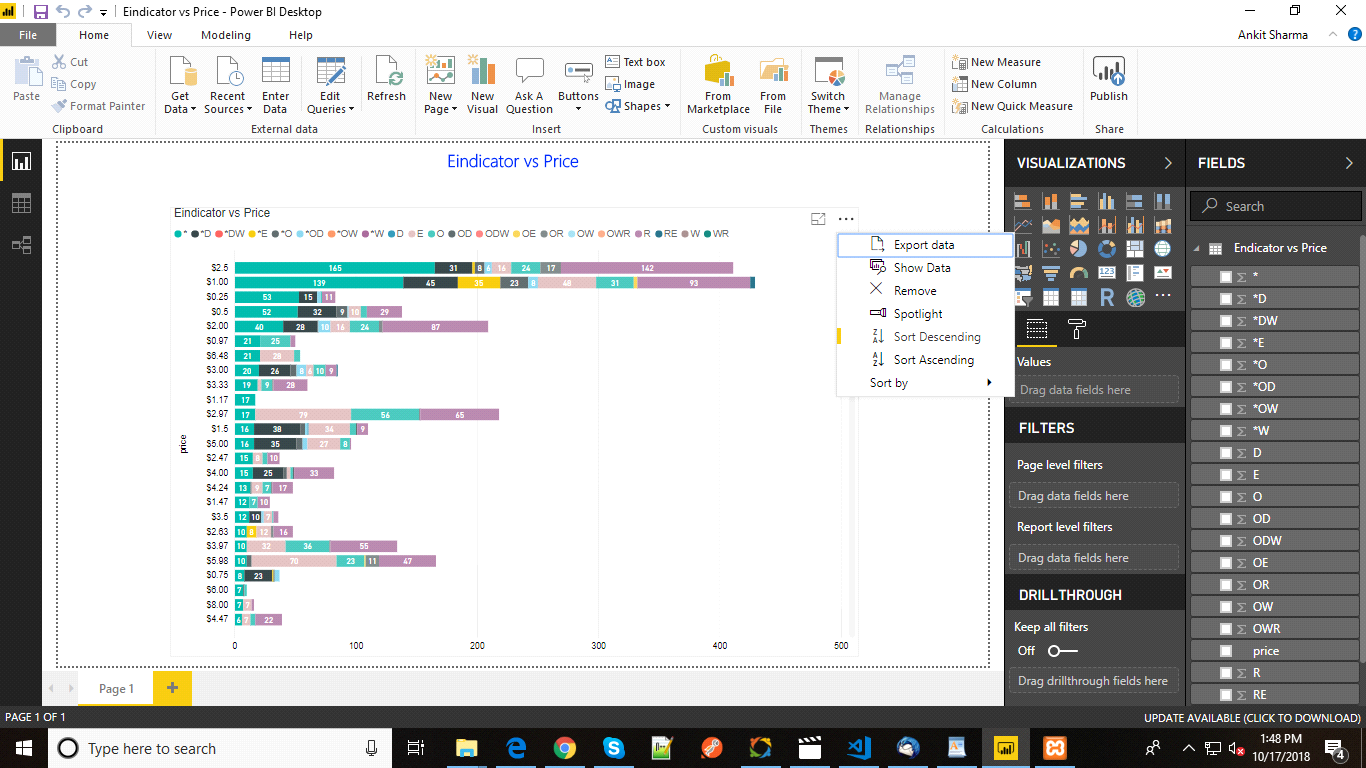
2. Click on Export Data and a popup will open and you need to save this file. This file is a csv format file.
3. Open the .csv file and you will get the data.
Exporting the data into the report
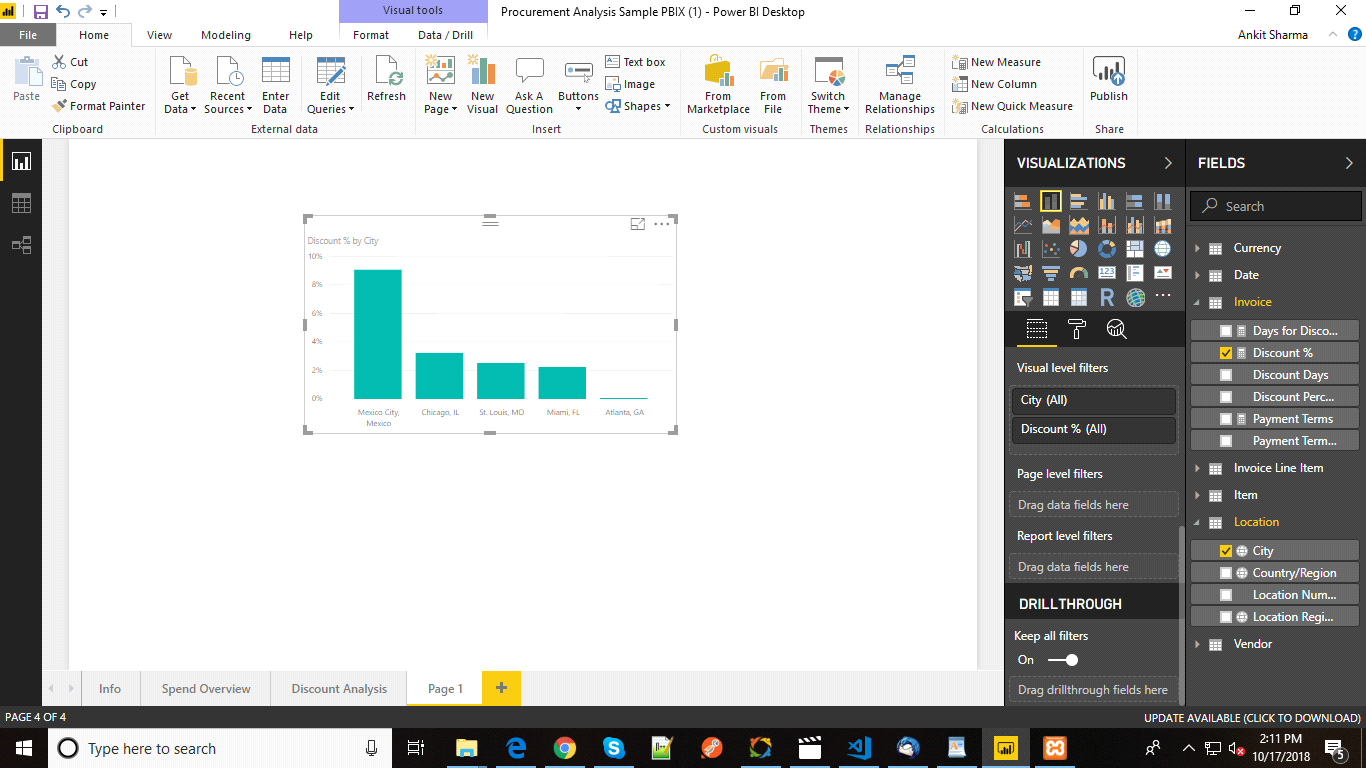
1. To follow along you can download one report from this link https://docs.microsoft.com/en-us/power-bi/sample-procurement and open it in your desktop application.
2. Create a bar chart by taking two columns one is your Discount Percent and other one is City. It looks something like this.
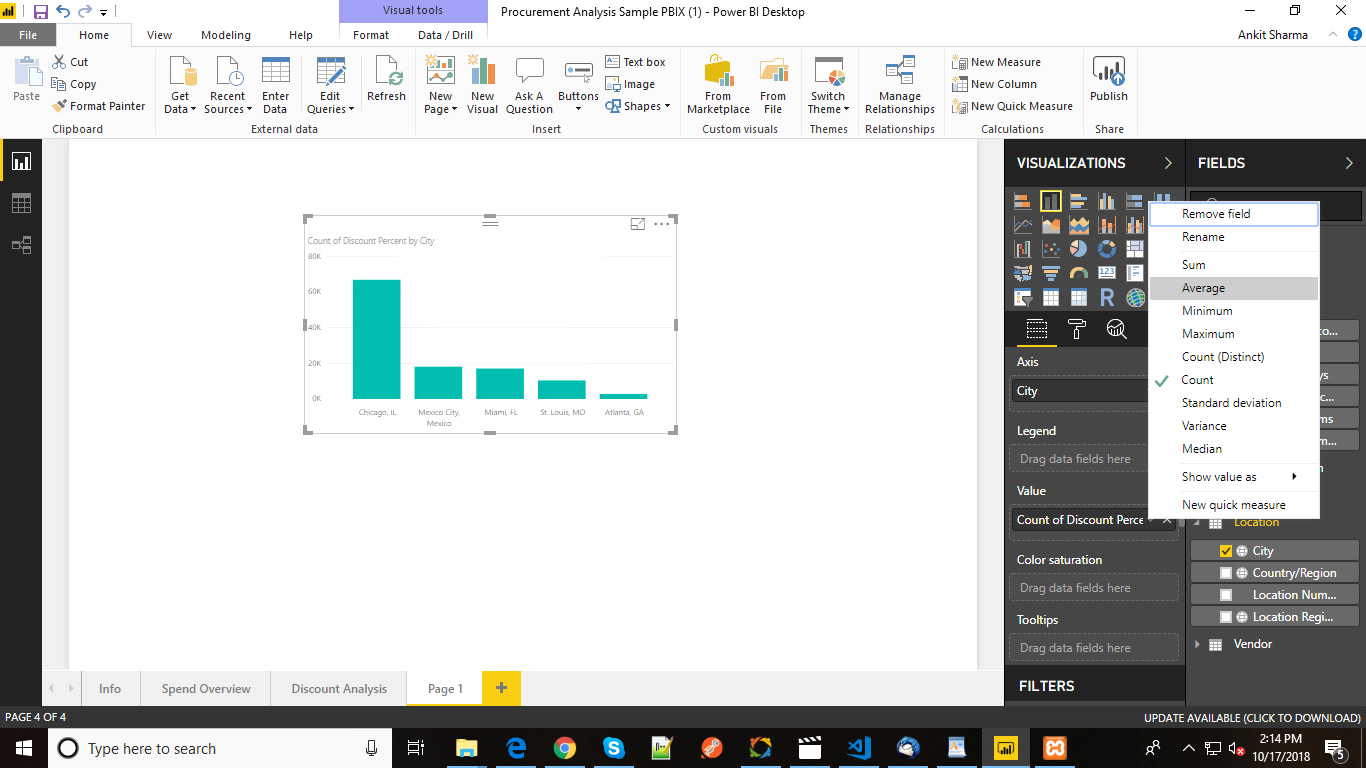
3. Now, you need to change the Aggregation of Count to Average as shown in the image.
4. Add some filtering to remove the data of Atlanta, GA
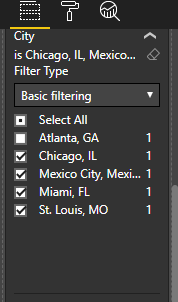
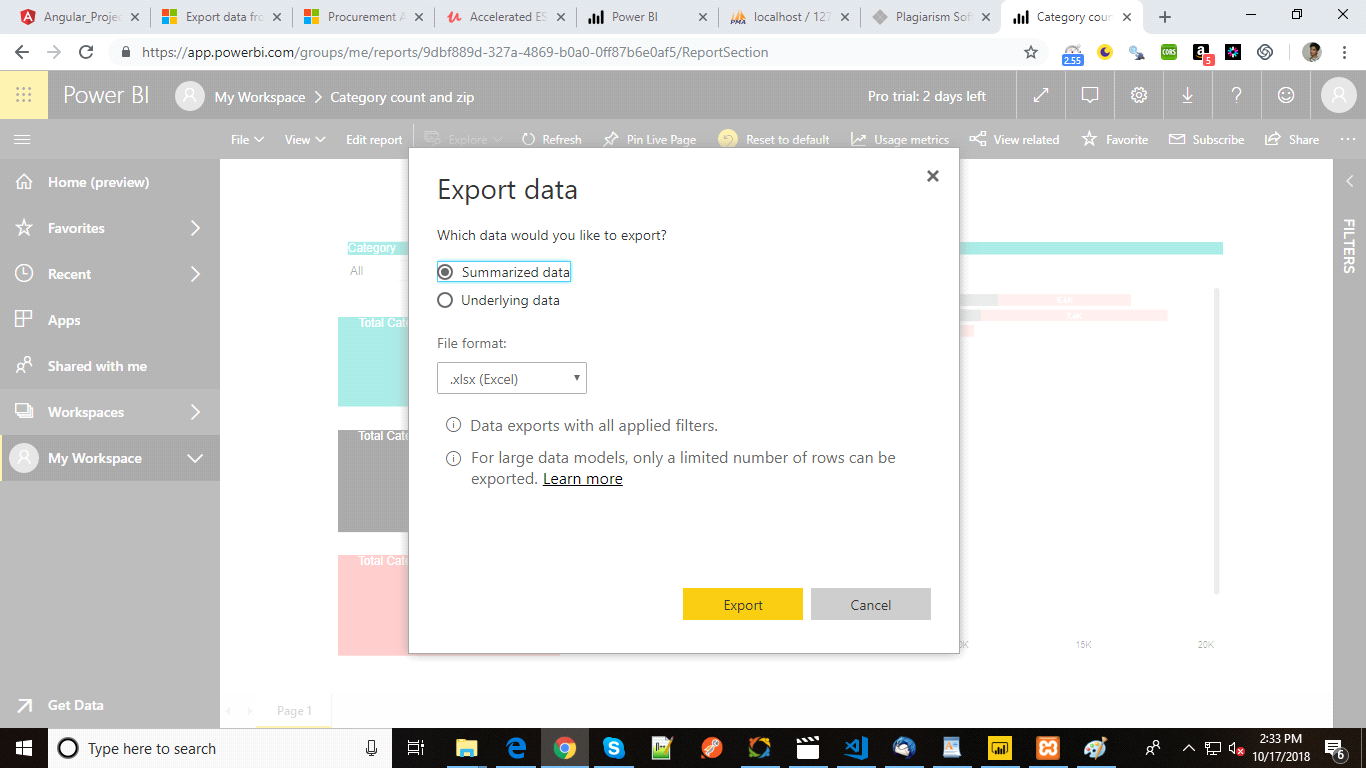
5. When you apply the filtering, you will see that the bar for Atlanta is gone and if you publish this report to Power BI service and you export data from Power BI service it will give you two options
- Summarized Data
- Underlying Data
In summarized data, if you have applied any filter in your report, the data will be exported as filtered and then you have to choose the file format. In Power BI service, there are two extensions in which you can save the file and after that click Export and save the file.
In underlying Data, it will export the data completely and if you apply any filter, it will still be going to export complete data.
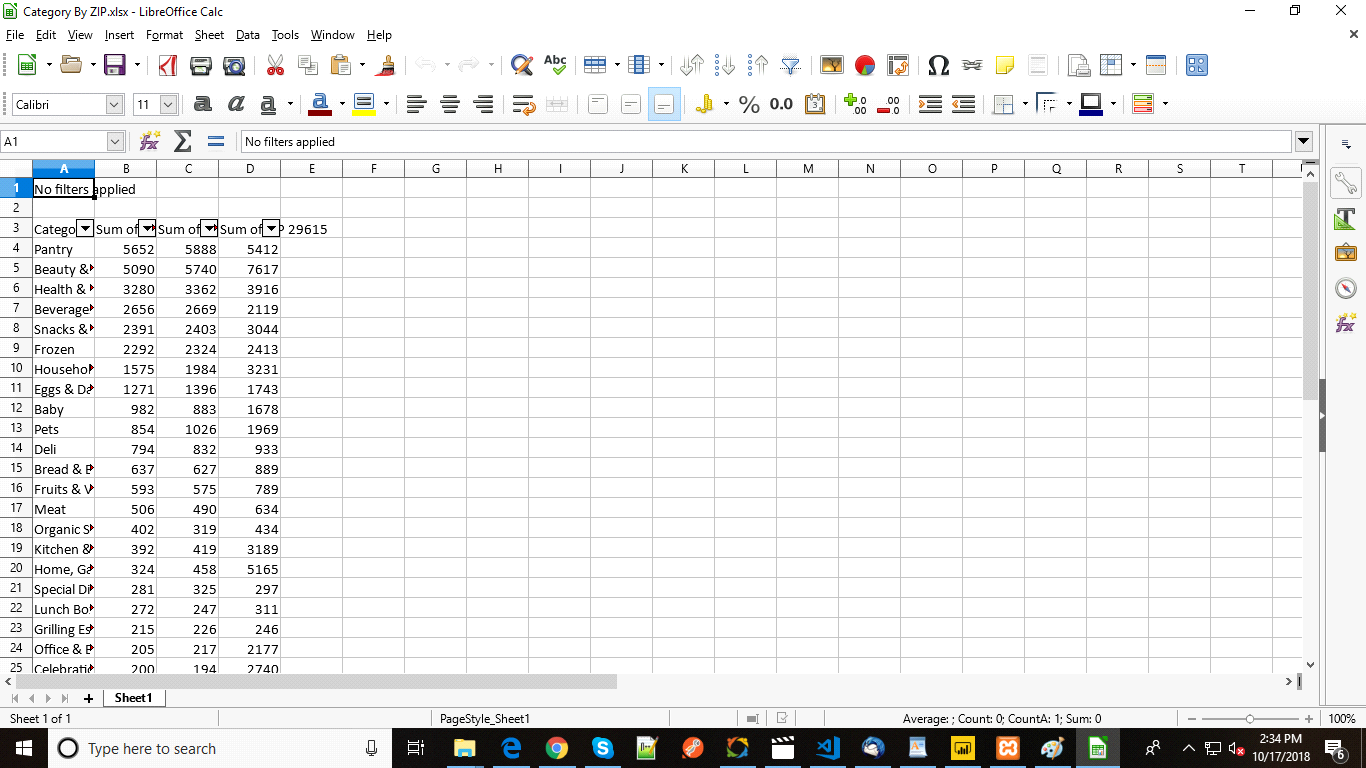
In my Power BI service account, it is looking like this and for the summarized data option, it creates a file which looks like this.
These two features are not present in Power BI desktop. It is only available in Power BI service. To understand it better, you need to first understand how to apply filter or set aggregates on the data.
Conclusion
In this article, I have given you a brief introduction on how to export data from visuals in Power BI service as well as Power BI desktop. I have not mentioned so many points like how to publish the report in service or how to apply filters. I have written separate blogs for these topics. I hope you understand it well and please write in comment if this blog is useful to you. It will give me more inspiration to share my knowledge with this platform. Thanks!
I excel when it comes to making bespoke data dashboards and visualizations that users and clients absolutely love. Sharing about things I enjoy doing is my hobby, whether it's about a project, collaboration, feedback, or just simple how-to guides about visualization.
If you have something to ask or share, I'd love to hear from you!
- Business Intelligence Vs Data Analytics: What’s the Difference? - December 10, 2020
- Effective Ways Data Analytics Helps Improve Business Growth - July 28, 2020
- How the Automotive Industry is Benefitting From Web Scraping - July 23, 2020
1 thought on “How to export Data from Visualizations in Power BI?”