Jump to Section
Introduction
In today’s blog, we will discuss November 2019 updates on Power BI. Microsoft launches its product updates very quickly. This indicates that their developers are working on the product day by day to improve its features. Power BI is a data analytics tool. It is better for visualizing and analyzing data. It helps you in creating and managing reports; you can share your reports in the organization or embed them on your website or application.
Power BI comes with two packages, one is power BI desktop, and the other is power BI services. Microsoft launches the Power BI updates in several areas of power BI desktop. Power BI November updates have major updates in several areas.
Conditional Formatting
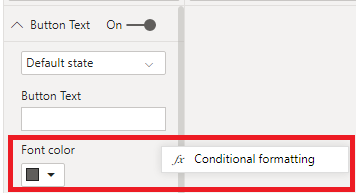
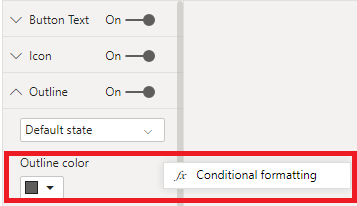
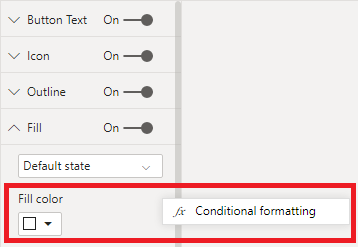
The November power BI updates include many changes. They have added changes to things like buttons. This is one of the favorite features because of this now; we can display icons instead of having to use DAX. You can dynamically set different properties for the following:
- Font color of the button text
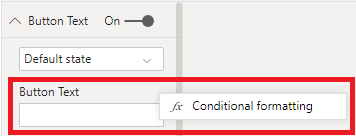
- Button text
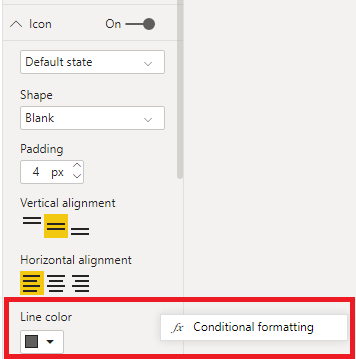
- Icon line color
- Outline color
- Fill color
- Button tooltip (under the action card)
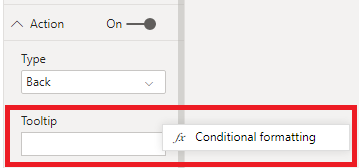
Once a property has been dynamically set, it will be replaced with an fx button.

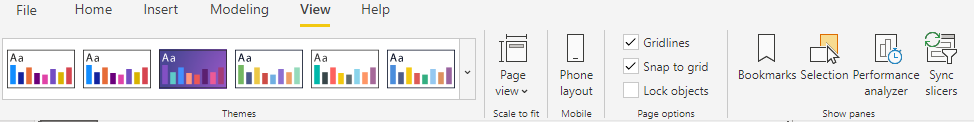
Modern Ribbon
As soon as you go into the desktop, you’ll see the difference right away. This new experience mimics the Office look and feels, we know. You can also click the up arrow on the far right and shrink this ribbon, and you will need to hover over to bring back the icons. Doing this will give you a clean, singular line of options to interact with, as well as more real estate to work within the workspace.
Compared to the previous ribbon, this latest ribbon has several advantages:
- Better look
- Dynamic ribbon content based on your experience, so you don’t have several disabled buttons in the view of data and modeling.
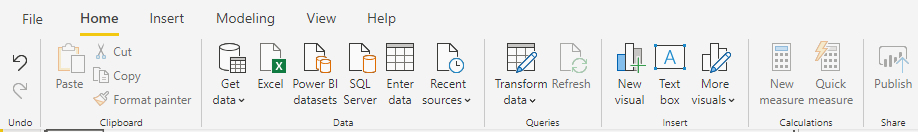
- When the ribbon collapses a single-line ribbon that allows you to save space while working.

- For features, for example, a visuals gallery in the ribbon, use more flexible and intuitive controls.
- Fill the Power BI Desktop with the black and dark grey Office themes.
- A theme gallery, where you can more easily see what colors will be applied.
The Decomposition Tree Visualization
This visualization was inserted straight into the dashboard of the Power BI. Normally, if you want a new visual, you can go to the marketplace to see all of the available custom graphics, and there are hundreds of them, but this one was brought right into the Power BI tool. A few new visuals have been added recently, such as the Key Influencers Visual and the Q&A Visual and Power Apps being out of the box rather than custom, but trust me, it’s rare to have these added right into the tool.

As you turn on the visual through the Options dialog’s preview tab, you will see the new visual option in the visualization pane.

Once you have added the visual to your page, you’ll see two buckets in the field. In our case, Analyze (Sales Amount), is where you will position the numeric field you want to break down. The second bucket, Explain by, is where you will place all the possible fields through which you would like to break down your numeric field.

One of the fascinating differences in the tree of decomposition compared to other visuals is that you can dynamically choose which of the fields you want to look at and in what order in the field by definition. The initial view you will have is just the numeric value with a “+” next to it.

Through clicking on this +, you can either choose a particular field from the options provided to break down through or let the visual determine the field to use, depending on whether you are searching for the highest or lowest value.

You should look at the headers and the darkened lines as you go further down the tree to get a sense of what part of the tree you’re exploring.

If you select either high or low values to expand, you will also see a lightbulb next to the header to remind you that Power BI dynamically selects the field for you, and it will update and change as your data refreshes.

You can read more about Decomposition Tree visual from the official Power BI video (https://www.youtube.com/watch?v=kVli3Vm_kDo&feature=youtu.be).
AI Functions in Power Query
Some of the cognitive tools such as Azure machine learning, text analytics, and image recognition have the AI functions in power query. The BUT here is that only if you have Power BI Premium, Text Analytics, and Image Recognition are some of those capabilities available. It takes advantage of Azure Cognitive Services in the context that can be difficult to add to a Power BI Pro license, so just another reason to think about bumping up to Premium and take advantage of all that comes with that license.
-
- Such AI functions will be included in the Power Query Editor.
- Tap on the Home ribbon and then edit the Power Query Editor queries.
- You will see in the top ribbon, the three cognitive resources that we listed on the right.
- Tap on a question then; tap on text analytics in my app. At first, it will ask you to log in to Windows.
- Once you’ve logged in, you’ll see a box at the bottom asking you to point to your premium ai insight capability.
- You can then choose which form of text analytics function you want to use, such as language detection, key phrases extract, score feel, etc.
- If you’ve been in the Azure environment, you know these aren’t new, but what’s new is that they’re accessible via power bi itself and very quickly via the UI.

Conclusion
In this article, we have discussed some of the Power BI November 2019 updates, and for the rest of the November, updates stay tuned with us in the next blog, i.e., Part 2. You need to download the latest Power BI version or update your Power BI Desktop. You can then take advantage of new features after upgrading the Power BI. For more information about the Power BI Updates, you can go through Microsoft Power BI’s official website. Please comment in the comment section below if you have any questions. Happy learning!
I excel when it comes to making bespoke data dashboards and visualizations that users and clients absolutely love. Sharing about things I enjoy doing is my hobby, whether it's about a project, collaboration, feedback, or just simple how-to guides about visualization.
If you have something to ask or share, I'd love to hear from you!
- Business Intelligence Vs Data Analytics: What’s the Difference? - December 10, 2020
- Effective Ways Data Analytics Helps Improve Business Growth - July 28, 2020
- How the Automotive Industry is Benefitting From Web Scraping - July 23, 2020
1 thought on “November 2019 Updates on Power BI (Part I)”