
Hello, in this blog I’m going to discuss the latest features of Power BI October Updates. I think Google and Microsoft are the only two companies which lunch their product updates very quickly, that clearly indicates that their developers are working on the products to improve their features. These updates are very helpful for the users who use it. Power BI is a tool that helps you in creating and managing reports, you can create reports for phone layout as well as for web view.
Power BI comes with two packages, one is Power BI desktop and other is Power BI service. Microsoft launches the Power BI updates with both minor and major improvements. The biggest improvement or you can say change is the support in Power Bi service for both composite model and aggregation previews, we will discuss it later in deep. This feature enables you to take advantage of these preview features end-to-end for your ordinary reports. Power BI also provides two more important data preparation features in October updates: fuzzy matching capabilities when we are merging queries and data profiling for helping in the identification of quality issues. Below is the complete list of Power BI October Updates. Let’s have a look at this.
Jump to Section
Reporting
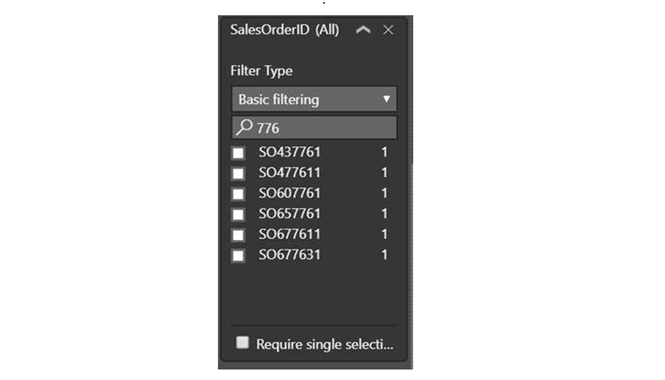
Search option in filter card: In June 2016 search option is available in only slicers but now this search feature is added in filter cards also so that you can search the value you want to show. Below is the screenshot of the same.
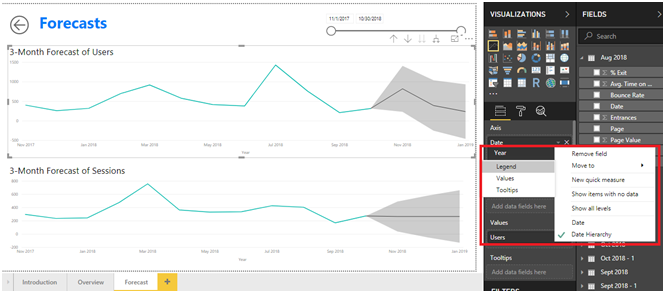
Improved accessible authoring experiences: In this feature, you can see the highlighted area. This feature enables you to edit the field properties. Also, you can easily change the values tool-tips and legends for a particular column in the sheet. This feature is available for both packages as Power BI desktop and Power BI service.
Performance improvements for ArcGIS Map: After this improvement, all the maps will load up to 50 % faster than previous maps. Now, you can easily show upto 30000 points on the map using latitude and longitude point locations. Also, you can draw 1500 areas on the maps. Below is the screenshot of the same.
In the above picture, you can see the points on the map.
Modeling
DAX editor improvements: This feature improves the look of the editor as well as the features of the editor. This adds the new keyboard shortcuts, line numbers and also indent lines. The editor is similar to the Microsoft’s Visual code editor. Below is the screenshot of the same.
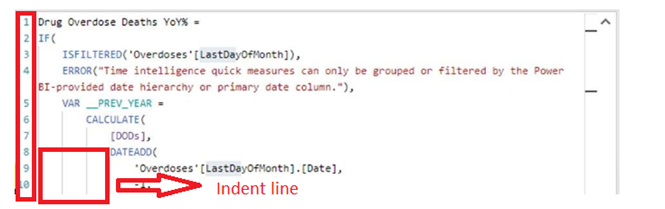
You can see the highlighted section that shows the Line numbers and indent lines. Below is some keyboard shortcuts list.
| Alt+ ↑ / ↓ | Move line up/down |
| Shift+Alt + ↓ / ↑ | Copy line up/down |
| Ctrl+Enter | Insert line below |
| Ctrl+Shift+Enter | Insert line above |
| Ctrl+Shift+\ | Jump to matching bracket |
| Ctrl+] / [ | Indent/outdent line |
| Alt+Click | Insert cursor |
| Ctrl+I | Select current line |
| Ctrl+Shift+L | Select all occurrences of current selection |
| Ctrl+F2 | Select all occurrences of current word |
Analytics
- Composite models & Aggregation support in the Power BI service (preview)
- Explain the increase for non-additive measures
Custom visuals
- Mapbox updates – 3D extrusion on fill maps & more
- Various bar & column chart visuals by Akvelon
- 3AG Systems ‑ Column chart with small multiples
- 3AG Systems ‑ Bar chart with absolute variance
- 3AG Systems ‑ Column chart with relative variance
Data connectivity
- Web By Example connector is now generally available
- SAP BW Connector implementation v2 is now generally available
- SAP BW Message Server Connector is now generally available
- Vertica connector is now generally available
- Dynamics NAV and Dynamics 365 Business Central connectors are now generally available
- New Dynamics 365 Business Central On-premises connector
Data preparation
- Data Profiling in Query Editor (preview)
- Fuzzy Matching options for Merge Queries (preview)
Other
- Control export data options for your reports
- Transport layer security settings
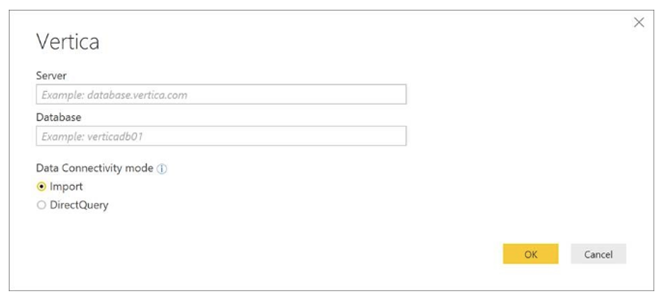
Connect to Vertica Database
This is one of the main features added in the October Release of Microsoft Power BI. Now we can import the data and create reports based on that data from the Vertica database. You need to first connect the Vertica database. If you want to refresh datasets in the power BI service and data is coming from the Vertica database then you must need to update your Power BI.
Conclusion
In this article, I have discussed the Power BI October updates. You need to download the latest version of Power BI or you can simply update your Power BI Desktop. After updating the Power BI, you can take advantage of new features. For more details about the Updates of Power BI, you can go through the official website of Microsoft Power BI. Please go through the link that I’m providing here Power BI October Updates. If you have any query, please comment in the comment section below. Happy learning!
I excel when it comes to making bespoke data dashboards and visualizations that users and clients absolutely love. Sharing about things I enjoy doing is my hobby, whether it's about a project, collaboration, feedback, or just simple how-to guides about visualization.
If you have something to ask or share, I'd love to hear from you!
- Business Intelligence Vs Data Analytics: What’s the Difference? - December 10, 2020
- Effective Ways Data Analytics Helps Improve Business Growth - July 28, 2020
- How the Automotive Industry is Benefitting From Web Scraping - July 23, 2020
1 thought on “What Are The New Features Of Power BI? October Updates!”