
Artificial Intelligence is like a camera fitted on a tripod so that the photographs and videos captured are perfect. The three supporting legs are the coding, the statistical calculations for analysis, and the business predictions based on these analyses. In the words of Jeff Hawkins, the key to Artificial Intelligence lies in the representation of that data.
Since important corporate decisions like procurement of raw materials, production schedules, marketing, delivery schedules, etc. are based on the statistical data. Data Science is a very precise science which are no room for errors. In analyzing finance, there are manageable methods to use averages in Data Analytics for predicting possible outcomes.
The common statistical forms used in machine learning models are averages so that near-accurate predictions can be made by querying Big Data. Of course, the type of averages you will use in your data model will depend on which type of calculation you intended carrying out, like addition, grouping, multiplication, or division of sets and subsets.
Jump to Section
BASING YOUR DATA MODEL ON AVERAGES

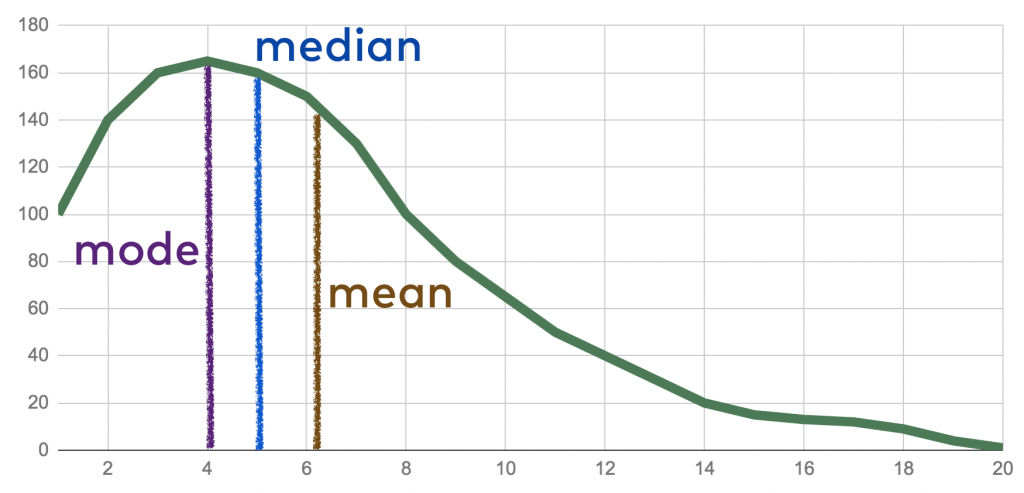
Unless you know what the role of averages is in analyzing mined Big Data, you will not know whether you are using averages in the proper way in your model. One aim of using averages is to form a representative sample subset by implementing certain rules of averages. In statistics, a single value which is a representative of large volumes of data is either a mean, median, or a mode.
Using averages in your machine learning model may or may not give you the most perfect representative sample. But rather than avoid using them, you can make them work for you by testing them with all possible assumptions and against all possible scenarios. Here are some simple steps to handle improper use of averages, or preferably to prevent improper use of averages.
GRAPHS
Test your averages-based model with the help of graphs like:
- Histogram – A histogram is the rectangular representation of a distribution of numerical data to calculate the probability distribution of a quantitative continuous variable. The independent variable is plotted on the X-axis and the dependent variable on the Y-axis.
- Boxplot – This is a five-number summary formed into a rectangular graph. Horizontal lines divide the plot into minimum, first quartile, median or second quartile, third quartile, and the maximum which form the test subsets.
- Individual Value Plot – Just like the Boxplot, this too can be used to analyze and compare data distribution but the output is slightly different. The Boxplot displays data as sets, whereas the IVP displays individual values of data.
USE THE MEDIAN TOO
When you sort your quantifiable data from the smallest value to the largest and choose the middle, you have your mean. The mean alone may not work for Big Data analysis like in the case of GDP, census, and other such huge volumes of data that have multiple variables. If you have an even distribution then the average of the middle two values becomes your median. But this too has specific applicability.
NORMALITY TEST
Once your data model has been set for calculating the median properly, irrespective of whether there is an odd or even distribution of values, you must carry out a normality test with data that was captured in real-time and saved as a test sample. In other words, you have to check whether the data model answers all the queries and can deal with all the possible assumptions.
HOW TO HANDLE IMPROPER USE OF AVERAGES IN DATA ANALYTICS?
Let’s say you are creating a data model to predict the increase in demand over the next 10 years for a brand of luxury sports footwear. Now, this type of footwear is not a dire necessity. It is an elitist product but for the last 10 years it has been in increasing demand. Your client may want to know whether this upward trend will continue during the next 10 years.
So far, with the help of Data Analytics tools and consequent marketing strategies, the demand for the high-end sports footwear has grown tremendously. But if your data model does not have a parameter to detect unusual situations like sudden fall in demand due to recession or natural calamities, the averages-based calculations and predictions will go awry if such a situation occurs.
Your Business Intelligence model must also learn to analyze a zero-yield scenario and not just the higher-than or lower-than-average scenario. In fact, a data model that is designed to predict even such an outcome will be able to detect some hidden overheads that your client may be incurring like the effect of taxes and other fees on the demand for products. The 0-yield factor incorporated in your averages data model will help your client to plan ways to reduce costs.
Applicability is another factor you need to consider while using averages like mean, median, and mode in your algorithm to predict outcomes. For example, you cannot base your data model on the worst case situation for insurance policies. You cannot design your data model based on either the average number of death-claims or the average number of policy-maturity claims. How can you predict that the insured person is definitely going to depart for the better world during the term of the policy and that you will have to settle the claim before maturity? So the use of averages is relative to the situation and should not be used indiscriminately.
To sum up, statistical computations like averages have been the measuring scales for predicting future behavior since ages. In most cases, they can be used successfully in designing an Artificial Intelligence or Data Analytics tool to foresee the future behavior of customers. These predictions form the fundamental bases for business enterprises to plan their procurements, production, marketing, dispatch and delivery processes to a successful conclusion. But using these simple steps to handle improper use of averages will serve the purpose of producing correct results with all the variables without missing any.
I excel when it comes to making bespoke data dashboards and visualizations that users and clients absolutely love. Sharing about things I enjoy doing is my hobby, whether it's about a project, collaboration, feedback, or just simple how-to guides about visualization.
If you have something to ask or share, I'd love to hear from you!
- Business Intelligence Vs Data Analytics: What’s the Difference? - December 10, 2020
- Effective Ways Data Analytics Helps Improve Business Growth - July 28, 2020
- How the Automotive Industry is Benefitting From Web Scraping - July 23, 2020