
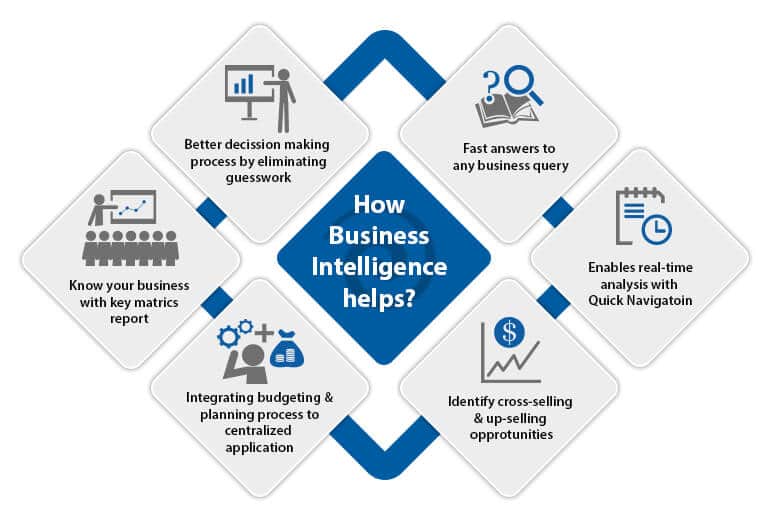
Business Intelligence is an activity that contributes to the growth of any company. BI is the act of transforming raw/operational data into useful information for business analysis.
Jump to Section
How Does Business Intelligence Works?
There is a certain format in which everything works and the same applies to Business Intelligence. Wanna know them? Here they are…
- BI based on Data Warehouse technology extracts information from a company’s operational system.
- The data is transformed (cleaned and integrated) and loaded into the data warehouse.
- Since this data is credible. It is used for business insights.
Why Data Warehousing?
Data Collected From various sources and stored in various databases cannot be directly visualized. The data first needs to be integrated and then processed before visualization takes place.
Data Warehousing: In Brief
A central location where consolidated data from multiple locations(databases) is being stored.
Data Warehousing is maintained separately from an organization’s operational database. End users access it whenever any information is needed.
Note: The Data Warehouse is not loaded every time new data is added to the database.
Advantages of Data Warehousing
- The strategic question can be answered by studying trends.
- Data Warehousing is faster and more accurate.
Note: Data Warehouse is not a product that a company can go and purchase, it needs to be designed and depends entirely on the company’s requirement.
Properties of Data Warehousing
“A data warehouse is a subject-oriented, integrated, time-variant and non-volatile collection of data in support of the managements’ decision-making process” – Bill Immon, the father of data warehousing.
Subject-oriented: Subject-oriented usually contains categorized data and stored by business subject rather than by its application.
Integrated: Integrated data on a given subject is collected from different sources of data collection and stored in a single place.
Time-variant: Organized data is stored as a service of snapshots, each one of data representing a period of time.
Non-volatile: Typically data in the data warehouse is not updated or deleted.
Key Terminologies related to DWH Architecture
Below are the key terminologies related to DWH architecture.
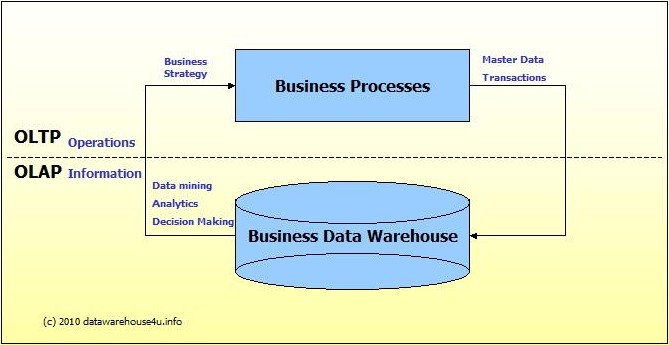
OLTP vs OLAP
Information Technology systems, that can be divided into two parts. One is transactional (OLTP) and the other is analytical (OLAP). Generally, we can imagine that OLTP systems provide source data to a different stage of data warehouses, whereas OLAP systems help to analyze it.
Online Transaction Processing (OLTP)
OLTP is defined as a large number of short online records (INSERT, UPDATE, DELETE). Online Transaction processing systems provide fast data modification, data processing, data duplication in multi-access of time, and an effectiveness measured by a number of records per second.
In this database, there is detailed and current data, and structure used to store transnational databases as an entity model (usually 3NF).
Example: All bank transactions made by a customer.
Below are few pointers for its deeper understanding:
- Contains current data.
- Useful in running the business.
- Based on the entity-relationship model.
- Provides primitive and highly detailed data.
- Used for writing data into the database.
- Database size ranges from 100MB to 1GB.
- Quickly provided, high performance.
- The number of records accessed are in tens.
Online Analytical Processing (OLAP)
This term is defined by the relatively low volume of transactions. Queries are generally complex and involve aggregation. In this type of OLAP system, response time is an effective measure, applications are widely used by Data Mining techniques.
In the OLAP database, there is aggregated, historical data stored in multi-dimensional schemas (usually star schema).
- Contains historical data.
- Useful in analyzing the business.
- Based on the star, snowflake, and the fact constellation schema.
- Provided summarized consolidated data.
- Used for reading data from the data warehouse.
- Data warehouse sizes range from 100GB to 1TB.
- Highly flexible but not fast.
- The number of records accessed is in millions.
Example: Bank transaction made by a customer at a particular time.
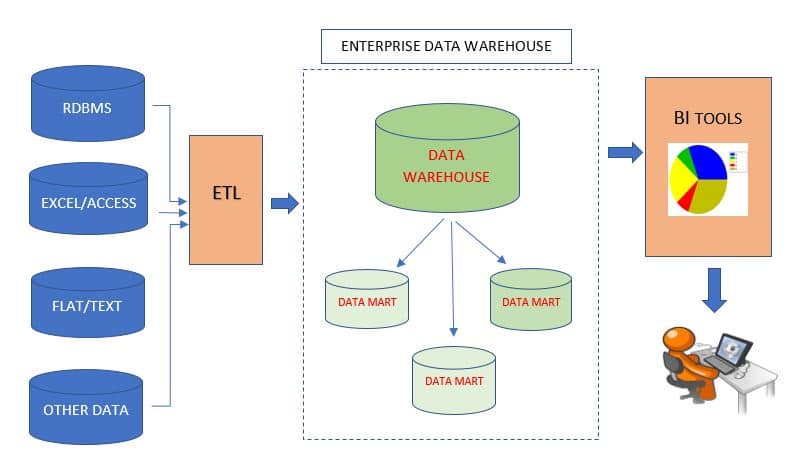
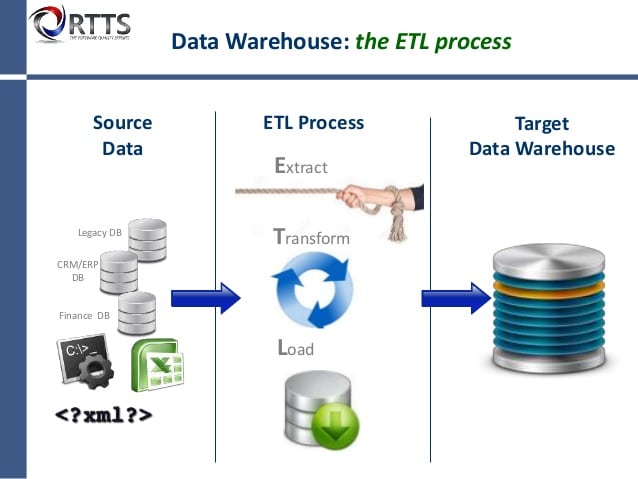
Process of Data Warehouse
ETL stands for Extract, Transform, and Load. An ETL tool extracts the data from different R-DBMS sources, transforms the data like applying calculations, etc., and then loads the data to the Data Warehouse system, in the form of dimension and fact tables.
Extraction
- To perform the extraction process, a staging area is required during the ETL load.
- The source systems are available for a particular period of time to extract data. The time period is less than the total data-load time. Such that the staging area allows extracting the data from the source of the system and keeps it in the staging area before the time slot ends.
- The staging area is required to get the data from multiple data sources together or to join two or more systems together.
- Data extractions’ time slot for different systems varies as per the time zone and operational hours.
- Extracted data from a source of systems can be used in multiple data warehouse system, Operation Datastores, etc.
- ETL allows to perform complex transformations and requires the extra area to store the data.

Data Transformation
In data transformation, a set of functions are applied to the extracted data to load it into the target system. A single unit of data that does not require any transformation in organized data is known as a direct move or pass-through data.
Load
During the Load phase, the data is loaded into the end-target system or destination system and it can be a flat file or a Data Warehouse system.
Data Mart
Data Mart is similar to a data warehouse, but the difference is it deals with a single subject. It focuses only on one area. The time taken to build a data mart is quite lower when compared to building a data warehouse. Data marts are confined to subjects.
Key Points About Data Marts

- Windows-based or Unix/Linux-based servers are used to implement data marts, implemented on low-cost servers.
- The life cycle for data marts may be complex in the long run if their planning and design are not organization-wide.
- Data marts are small in size.
- All data marts are customized by the department.
- Data marts are flexible.
Metadata
Metadata is the summarized data that leads us to the detailed data. We can simply define metadata as data about data, i.e. data that is used to represent other data is known as metadata. For example, the index of a book serves as metadata for the contents of the book.
Data Cube
The structure of the data cube is defined as OLAP to achieve multi-dimensional functionality. A data cube is used to represent data along with some measure of interest. It allows looking at complex data in a very simple way.
Example of a Data Cube
Suppose a company wants to keep track of sales records with the help of a sales data warehouse with respect to time, item, branch, and location. These dimensions allow to keep track of monthly sales and at which branch the items were sold. There is a table associated with each dimension. This table is known as a dimension table.
Let’s take an example: A single dimension of any data table may have attributes such as item_name, item_type, and item_brand.
The following table represents the 2-D view of Sales Data for a company with respect to time, item, and location dimensions.

Thereafter, in the 2-D table, we have multiple records with time-bound and items only. The sales for New Delhi are shown with respect to time, and item dimensions according to the type of items sold.
However, If we need to view the complete sales data with one more dimension, let’s say, the location dimension, then the 3-D view would be useful. The 3-D view of the sales data with respect to time, item, and the location is shown in the table below −

The above 3D table can be represented as a 3D data cube as shown below −

Three-Tier Data Warehouse Architecture
Generally, a data warehouse adopts a three-tier architecture. Below are the three tiers of the data warehouse architecture.
1. Bottom Tier
This tier constitutes data warehouse, data marts, metadata, monitoring, and administration. This tier is a warehouse database server that is almost always a relational database system. Data is fed to this tier from operational databases and external sources using back-end tools and utilities. These tools and utilities first perform extract, transform, load, and refresh functions on the data.
2. Middle Tier
This is available in an OLAP Server that allows implementation in either of the following ways:
- In Relational term of OLAP (ROLAP), which is an extended relational database management system. The ROLAP defines multiple operations on the multidimensional data model to analyze relational data operations.
- Multidimensional (MOLAP) model that directly implements the multidimensional data and operations.
3. Top-Tier
The top tier is the last layer of the data warehouse structure. It is the front-end client layer. This layer holds the query tools and reporting tools, analysis tools, and data mining tools.
The below diagram shows the 3-tier architecture of the data warehouse−

Wrapping Up
Data Warehousing is not a new phenomenon. All large organizations already have data warehouses, but they are just not managing them. In the coming years, the demand for data warehousing is going to become enormous with new products, services, and technologies coming out individually.
In order to get the most out of this period, it is going to be important that data warehouse planners and developers have a clear idea of what they are looking for and then choose strategies and methods that will provide them with the performance today and flexibility for tomorrow.
- Difference Between SQL and MySQL - April 14, 2020
- How to work with Subquery in Data Mining - March 23, 2018
- How to use browser features of Javascript? - March 9, 2018