
In this article, you are going to learn how to create calculated columns in Power BI Desktop and how to use these columns into the report. First, let’s understand what are calculated columns and where we need to use these columns. When you create a report, sometimes the data you need is not available in your dataset, then you need to add a column. I’ll explain this to you with an example. Suppose, in our data we have two columns FirstName and LastName but I want to show data based on FullName. In this case, you need to create your own custom column. To create a custom column, we use DAX (Data Analysis Expression) which is a query language used in Microsoft Power BI Desktop to get the desired result. If you are from a programming background you can resemble it as an SQL language. In SQL, we extract, insert, edit the data from a database same with DAX but it is only available within Power BI desktop. You cannot use it outside.
The process of creating calculated columns is similar to creating measures but you cannot use the measure as a row, column or legends in the visuals. You need to put measure in the Value field but Columns you create can easily be used as rows, columns, and legends. To understand it better you must have a basic understanding of how to Get Data and Power Query Editor to import data.
The data we are going to use in this complete tutorial Contoso Sales Sample For Power BI Desktop. You can download this from the link here. http://download.microsoft.com/download/4/6/A/46AB5E74-50F6-4761-8EDB-5AE077FD603C/Contoso%20Sales%20Sample%20for%20Power%20BI%20Desktop.zip
The zip folder contains a .pbix file and you need to open this in Power BI desktop. So now let’s jump straight to our main topic.
Create a calculated column
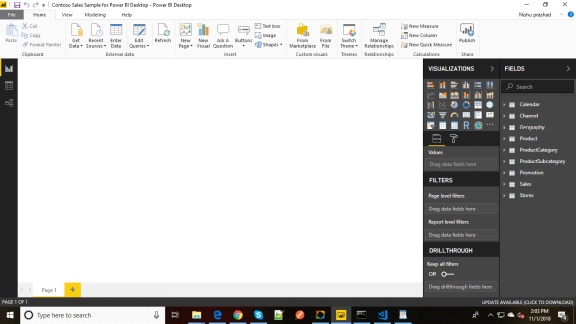
First, import the .pbix file into your Power BI desktop. You are free to use any file. The screen looks like the below image. You can see all the tables are imported into the Fields section.
We need to combine two columns ProductCategory and ProductsSubcategory into a single column Computer-Monitors. We need to take one value from each value from both the columns and combine them. To create a new column, we need to use DAX expression. If you want to combine any column from two tables, you must have a relationship between the tables. Power BI does this for us automatically. In some cases, you will see there is no relationship present. In that case, you need to create it on your own. In our case, the relationship is already present. You can verify this from the image below.
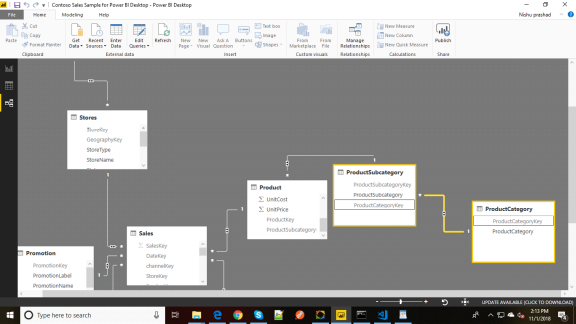
Both the tables are connected to each other with the column name ProductCategoryKey. To create a column, you need to follow these simple steps which are listed below.
1. Right Click on the table ProductSubCategory or three ellipses (three dots), A popup appears.
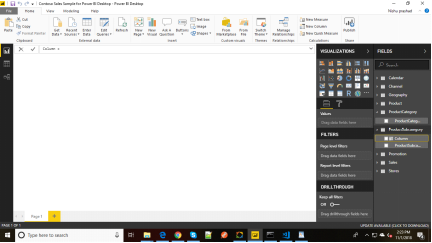
2. In the popup window, select New Column. It will open a dialog box at the top of your Canvas.

3. Within the dialog box, you will see the Column name appears. Also, a column is added to the ProductsSubCategory Table.
Replace the word Column with any name because this is going to be your Custom column name. We are going to use the name ProductFullCategory.
4. So our DAX expression is going to be ProductFullCategory and then type the (=) signs.
5. You need to use the Related function. Just type r, it will open a dropdown you need to select Related function and within parenthesis and within the brackets, you need to select the column name. Because first, we need Product Category so we need to select Product Category column from the table Product Category. So far, our DAX expression looks like this.
ProductFullCategory = Related(ProductCategory[ProductCategory])
6. After the category name, we want -(dash) between Product Category and Product Subcategory. To enter dash between two columns, you need to first add two ampersand(&) and between ampersand first enter space then double quote(“), space then dash, space, double quote(“) and another ampersand. Now the formula becomes:
ProductFullCategory = RELATED(ProductCategory[ProductCategory]) & ” – ” &
7. In this step, we need to select the ProductSubcategory column as we have selected in step 4. Now the complete DAX expression becomes:
ProductFullCategory = RELATED(ProductCategory[ProductCategory]) & ” – ” &(ProductSubcategory[ProductSubcategory])
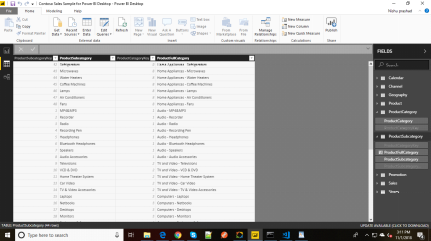
8. In the last step, you need to click enter. Our new column looks like this.
Now we can use this column to create interactive visualizations. To create different columns, you need to understand DAX expressions. I have written one blog on this. You can go through with this link https://www.loginworks.com/blogs/how-to-use-dax-functions-in-power-bi/.
Conclusion
In this article, we have discussed what are calculated columns and when we need to create calculated columns, how we can create our own calculated columns. To understand it deeply, first, you have a deep knowledge of DAX beacuse without DAX it is not possible to create calculated columns. Once you learn DAX, you can create any calculated column according to your needs. If you have any query regarding this article or any issue, you can write below in the comment section. Thanks!
- What Products Should You Sell on Amazon? - November 18, 2020
- 10 Reasons Why You Should Start Selling on Amazon - October 22, 2020
- Comparative Study of Top 6 Web Scraping Tools - September 3, 2020