Hey guys, this is the second article which I’m going to write on DAX language. My previous article was about DAX functions in power-bi. I have noticed that almost every guy is not perfect in Excel to create the data-set as required, they face many problems while creating the data-set. I’m very thankful to Microsoft for creating this language because it is very easy to create or manipulate new data-set using DAX.
DAX is a combination of variables and functions which is used to solve the data problems. We can easily understand the meaning of DAX from its name as “DATA ANALYSIS EXPRESSION “. We use DAX to analyze the data using expressions. That’s why its name is DAX. Internally DAX uses mathematical, Excel and statistic function to solve the data problems. There are two types of data as Numeric and Others, but I’m not going to describe all the data types here because all these data types are described in my previous article How to use DAX functions in Power-BI?.
DAX is widely used language for creating or manipulating the data. Data can be of any type, any form and from any source. For example, it could be in csv, xls or text format and from any database like Mysql, Azure active directory or postgreSQL.
Before starting the function of DAX, I want you to download the Power-BI desktop application to see the types of DATA Sources and where to write the DAX expression. So, I’m going to give you the link from where you can download the Power-BI desktop application. Below is the link of the same. The first link is for desktop application and the other links are for mobile applications.
1. Click to download Power-BI desktop application
2. Click to download Power-BI mobile application ( From Google play store )
3. Click to download Power-BI mobile application ( From App store )
4. Click to download Power-BI mobile application ( From Windows store )
Now, let’s start with the DAX functions.
Jump to Section
Types Of DAX function
There are many functions in DAX but here I’m only going to describe those functions which are mostly used in Power-BI to generate or manipulate the existing datasets. Below is the list of functions.
1. Date and time functions
2. Filter functions
3. Statistical functions
4. Math and Trig functions
5. Logical functions
6. DATATABLE function
7. Intersect function
8. Natural Inner Join function
Above are the functions that we use most of the time. But if you want to learn about all DAX functions in deep, So you can go through the link as shown below.
DAX Function ( Click to see )
Date and time functions
These functions are very basic because they are used in almost all the dataset to manipulate the data based on date and time. These functions are almost similar to the Microsoft Excel date time functions. They use datatime as data type and it takes value from table column as an argument. Date and Time function is further divided into multiple functions as mentioned below.
1. CALENDAR function
2. DATE function
3. DATEDIFF function
4. MONTH function
5. MINUTE function
6. DAY function
7. HOUR function
8. TIME function
9. SECOND function
10. NOW function
CALENDAR function
This function actually adds the column with calendar that contains dates with range. The range is specified by the start date and end date value. The syntax of the calendar function is as below.
CALENDAR(<start_date>,<end_date>)
Example 1 : Calendar column=CALENDAR (DATE (2005, 1, 2), DATE (2018, 1, 16))
The above function gives the dates between 2nd January 2005 to 16th January 2018.
Example 2 : Calendar column=CALENDAR ( MINX ( Sales, [Date]), MAXX ( Forecast, [Date]))
The above function gives the dates between minimum date from the Sales table and maximum date from the forecast.
DATE function
This function gives the date in datetime format. The syntax for the date function is as below.
DATE(<year>,<month>,<day>)
Example : =DATE(2009,7,8)
The above function returns the date 8th July 2009.
TIME function
This function gives the time in datetime format. The syntax for the date function is as below.
TIME(hour, minute, second)
Example : =TIME(27, 0, 0) or =TIME(3, 0, 0)
The above returns 3:00 AM.
NOTE: For other functions, you can go through DAX date and time function.
Filter functions
This function is very useful function because sometimes we need to extract some part of data from existing data. In that case, we need a filter function. The syntax of filter function is as below.
FILTER ( <table>, <filter>)
Example : =FILTER ( Sales, [amount] > 3000 )
The above function returns the list of amount greater than 3000.
STATISTICAL functions
This contains many statistical functions. Few of them are Average function, Count function, Max function, Min function and Median function.
Average function
This function return the arithmetic mean of all values in a column.
Syntax : AVERAGE(<column>)
Example : =AVERAGE( InternetSales[ExtendedSalesAmount])
Count function
This function returns the total count of values in a column. The syntax is as below.
COUNT(<column>)
Example : =COUNT([Shipdate])
LOGICAL functions
This contains multiple functions in the form of logical expression. These logical expressions are IF, AND, OR, SWITCH etc and their corresponding functions are as follows.
1. IF function
2. NOT function
3. OR function
4. AND function
5. SWITCH function
6. TRUE function
7. FALSE function
IF function
This function returns one value if the condition is true and returns other value if the condition is false.
The syntax is as follows.
IF(logical_test>,<value_if_true>,value_if_false)
Example : =IF([Calls]<200,”low”,IF([Calls]<300,”medium”,”high”))
OR function
This function returns true if any value is true in the expression. The syntax of the this function is as below.
OR(<logical1>,<logical2>)
Example :IF( OR ( CALCULATE ( SUM (‘ResellerSales_USD'[SalesAmount_USD] ), ‘ProductSubcategory'[ProductSubcategoryName]=”Touring Bikes”) >1000000 , CALCULATE ( SUM (‘ResellerSales_USD'[SalesAmount_USD] ), ‘DateTime'[CalendarYear]=2007 ) >2500000 ) , “Circle of Excellence” , “” )
AND function
This function returns true if both values are true. The syntax for this function is as below.
AND ( <logical 1>, <logical 2> )
Example : =IF (AND (10>9, -10<-1 ), “All true”, “One or more false” )
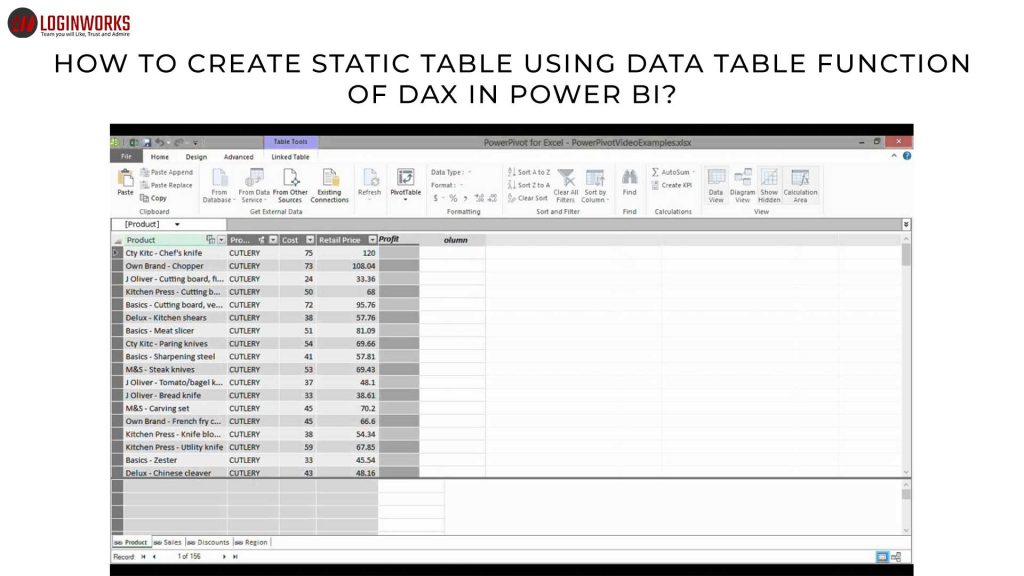
DATATABLE function
This function provides a way to create static data-set in the form of a table that cannot be refreshed. The syntax for creating the static dataset table is as below.
DATATABLE ( column1, datatype1, coulmn2, datatype2, { { value1, value2 }, { value3, value4 } })
Example : = DATATABLE ( ‘Name’, STRING, ‘Age’, NUMBER
{
{ ‘Deepak’, 32 },
{ ‘Kundan’, 25 }
})
Above example creates static table of two columns named Name and Age with data type String number.
Conclusion
In this article, I have described almost all useful functions with examples that will help you to create or manipulate the existing data set. If you want to learn more about DAX you can visit the link as mentioned in this article at the starting of the topic. If you also want to learn more about Power Bi, so you can go through the Microsoft’s web page. Thank you!
I excel when it comes to making bespoke data dashboards and visualizations that users and clients absolutely love. Sharing about things I enjoy doing is my hobby, whether it's about a project, collaboration, feedback, or just simple how-to guides about visualization.
If you have something to ask or share, I'd love to hear from you!
- Business Intelligence Vs Data Analytics: What’s the Difference? - December 10, 2020
- Effective Ways Data Analytics Helps Improve Business Growth - July 28, 2020
- How the Automotive Industry is Benefitting From Web Scraping - July 23, 2020
1 thought on “How To Create Static Table Using Data Table Function Of DAX In Power BI?”