Hello readers, I have come again with my amazing blog “How to utilize website traffic data”. First of all, let’s understand what traffic data is and how it gets collected?
Jump to Section
What is Website Traffic?
Website traffic is associated with web users who visit your website. Web traffic is collected in the form of user visits, as called “sessions”. Basically, web traffic is captured to see the increased popularity of an individual page, session within a website and organized websites. Web traffic can be seen in web server log file in the form of data visualization or statistical format. A webpage contains itself a file which is saved automatically in the background. It doesn’t matter you have visited one page or 50 pages on a website. Because every page’s traffic is measured individually and independently. By using Google analytics tool you can see the website traffic in details.

Note: A web “hit” is automatically generated when any new file is served. The web page and images itself is contained in a log file. Thus, a page with 4 images can generate 5 hits (the 4 page and the images itself). A web page view is developed when a new visitor requests any web page within the site and a user will always create at least a two-page view (the home page and within a page). A website generates traffic data by inserting an HTML code in each and every website page.
What happens in Website Traffic Data?
This information is generated when utilizing web traffic data as follows.
- The count of visitors and the average count of web page views per new visitor. A high number of values will indicate the average visitors that go deeper within the website.
- Total time visit duration – the complete length of a visitor’s visit information. It contains enough time they spend on the website and how much they are interested in your website.
- Total time page duration – how long a web page has seen for and many more web pages were viewed.
Domain class that contains the information on all levels of IP address that is needed to deliver content and web pages. - You can even monitor how effective your website is and you can also figure out that how many visitors are staying around.
- You can also measure the visitor’s interest on a particular page.
- Monitored information can be useful for marketing domain.
- You can find out easily where traffic data is coming from like as any other social networking websites.
To gather the website traffic data, you need to install the web traffic analyzer tool. For this reason, I have chosen Google Analytics, because it is very powerful and easy to understand. You can easily download this tool by its terms and conditions. So, let’s just understand how to install Google Analytic on your computer step by step.
How to Install Google Analytics
In this session, we will understand its installation process and we are going to cover how you can set it up correctly so you can actually start using the tool. Now, this is really an important part of the process because Google Analytics is not retroactive. It means once you send the data to the system, you cannot change it later. So, it’s really important to get that measurement part correct so you have to clean the data in your account that you actually report on and do analysis on the data and then get insights from.
Now, there are actually two ways to set up Google Analytics, one way is to install the Google Analytics code directly into your website and the other way is actually to install it through something called Google Tag Manager. So, I would recommend the GTM installation process if you have a little bit more time because it will give you more flexibility to change the tracking itself.
Step 1
Open the browser and search on Url bar as “google.com/analytics” and here you will see the list of all the products that are in the Analytics suite.
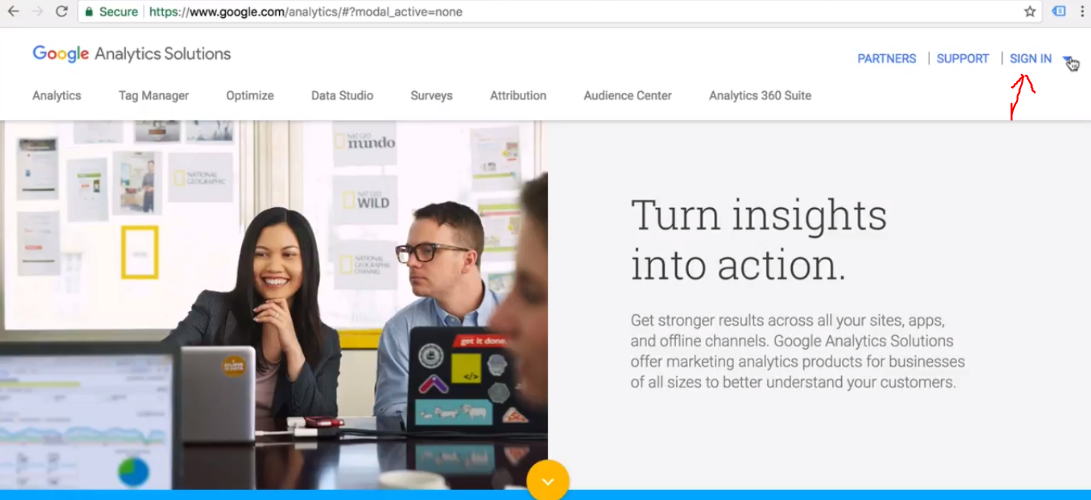
Step 2
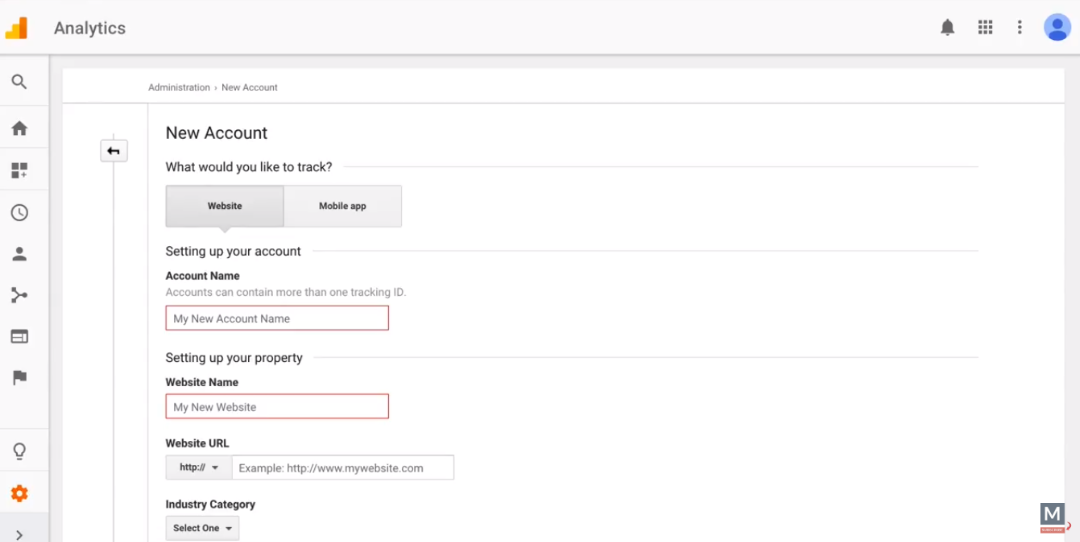
Click on Sign In, and then click on Analytics on the right side and log in with an account Complete your detail to the dedicated columns like “Account Name”, this is the collection of different tracking codes that you can have on your website. “Website Name”, put your company name in this column, and “Website URL”, put your website URL with naming convention either starts with “HTTP” or ”HTTPS”. Then, choose your “Industry Category”. Once you fill all these details and then click on the “Get Tracking ID” button with exception of terms and services at the bottom of the page.
Step 3
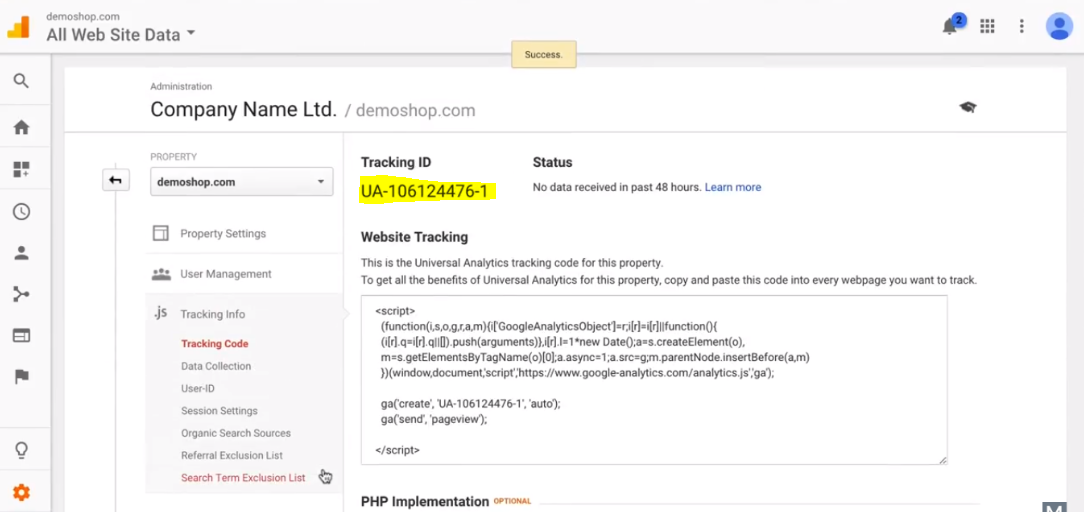
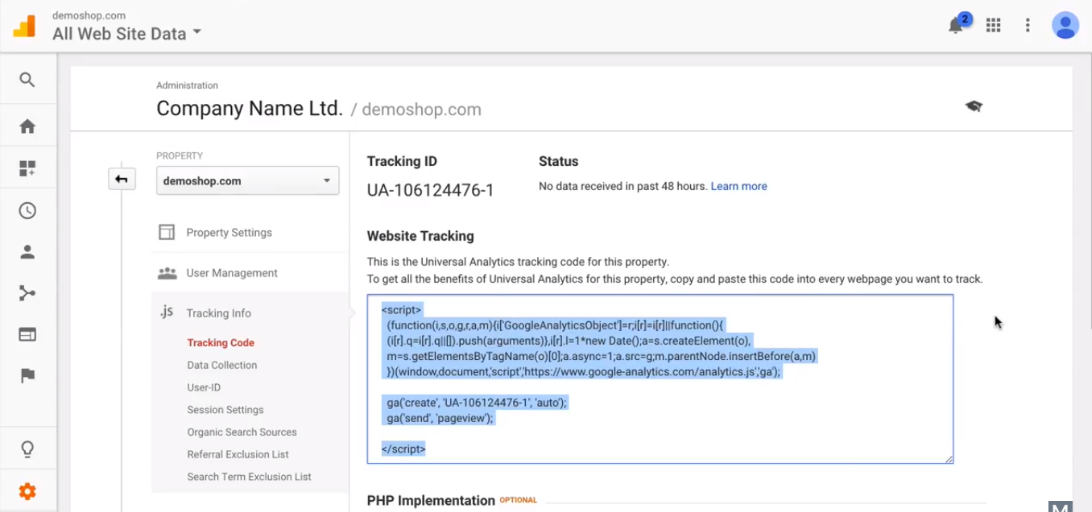
Once you click “Get Tracking ID”, a new page will pop with your tracking ID and website tracking script code in the column below. Now, this tracking code needs to be installed on each website page and its recommended to place this as high up as possible in the HTML code.
Step 4
You need to copy the tracking code and paste it in the <Head>/</Head> in the HTML page source of your website. Then, refresh your code and see the result on the Google Analytics home view.
As a result, we have just completed our installation process. Now, we will understand what is the work of Google Analytics in website traffic data, and how can we apply data analysis on website traffic data.
Google Analytic in Website Traffic Data
Google Analytics helps you measurement, report and analyze the behavior of the user coming to your website. In this session, you will learn about what exactly Google Analytic is? And how it works for gathering website traffic data overview? And how it can help you as a marketer and why you should use it.? Alright, so you have built a website and now you want to get many visitors to view your content, read your blog post or buy your product. Well, you have heard of Facebook ads, Google Adwords, SEO, Pinterest, and more. Now, the question comes how do you actually know how many visitors came to your website and where did they come from, and what did they actually do on your website. This is where Google Analytics comes in.
Measurement in Google Analytics
When you install Google Analytics you will receive a tracking code that you need to place on your website. What does it mean? When somebody goes to your website, this tracking code will send information to Google analytics. Data like which page is the user currently on, which browser is being used by the user, what other languages settings are off his browser, what was the last page that user was visiting before he comes to that website, and many other data points that Google analytics actually measures. This all happens in the backend through a technology called JavaScript. So, the user itself does not actually notice anything when they visit your website. Google Analytics itself the data gets recorded and stored. Then, we can see who is currently on our website.
Reporting in Google Analytics
Google Analytics builds many reports from the data we have measured. In the interface, they are divided in the “Audience” report so you can find out more about the technology that your users are using, where they are from and so on, and they the “Acquisition Report”. Where you can find out where the user came from that visited your website. The “Behaviour” reports, where we can find out what the user did on our website, which user visited, which interactions user took on our website, and then the “Conversion” report which is all about did the user actually take the action that you desired him to take on your website.
Now, all of these reports are built and get filled automatically by Google Analytics but you can obviously also build your own Custom reports within the interface, which we will not get into right now but it is definitely possible. Now, all of these reports do not do anything for you unless you start learning at them in detail, which brings us to our third step its analysis part.
An analysis in Google Analytics
So, here we see that most of the people come through organic search result of Google. Obviously, you might have further questions like, how to compare with last week, where did the user actually land on my website, and Google Analytics actually gives us many different tools to dig deeper into that data. We can filter our data, break it down further, visualize it differently, and compare it, and many more different techniques that are available within the tool to do a quick analysis. The ultimate goal of your analysis is to get to insights and then to actions. So, once you have found something out I would recommend getting to a conclusion to recommend stuff to your manager. For example
The realistic way to Utilize website traffic data
First of all, when you go to Google Analytics you can go up and choose the longest period of time. Google Analytics provides us with many ways to watch website traffic data in different segments. For better understanding, I have taken some random website to see the traffic in graphical format as below.
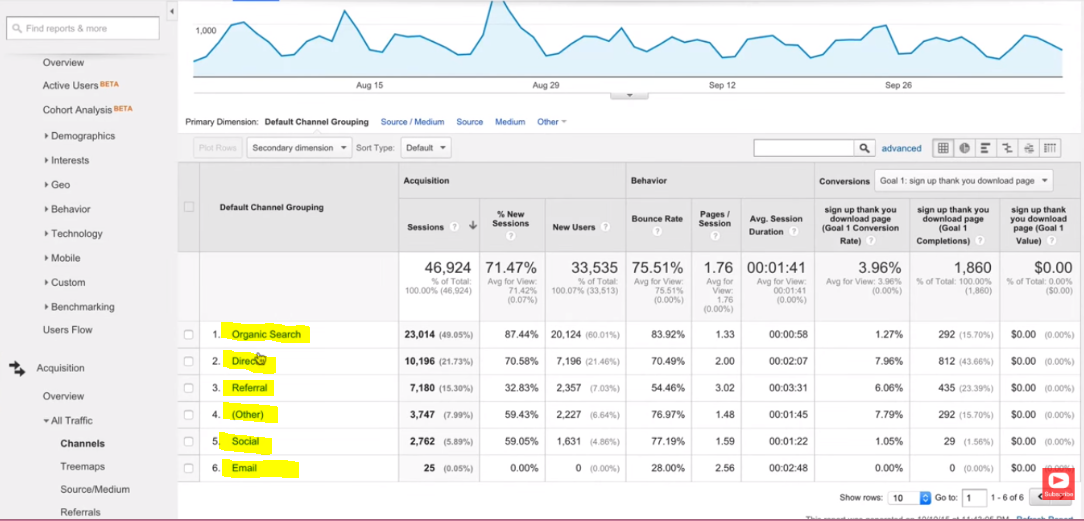
Now, Go to the Acquisition> All Traffic>Channels to watch all traffic channels history you can see exactly where they have come from.
Organic Search
It means Google search mostly that gives the most amount of traffic. If you select organic search then you actually see some really interesting information. As you can see Google actually with Held 95% of this information but you still get the keywords that visitors have typed into Google and other search engines before they came into your site. So, this is looking into the mind of your visitors because you can see what they are interested in.
Direct
It’s quite annoying because you do not actually know where they come from they may have typed in the URL in the address bar in the browser or from another link that Google can’t recognize.
Referral
This is related to other websites so if somebody links to you and you get traffic from that link that will be under referral.
Social
Social of course is coming from social websites. So, if a post of yours does very well on Facebook, of course, the traffic goes into this column. If you drill down any of these sections and you can see how much comes from Facebook, Twitter etc.
An email with a link to your website may be through email marketing services like “MailChimp” or “Aweber”. Then, it will display into this category or even it may show up in direct view.
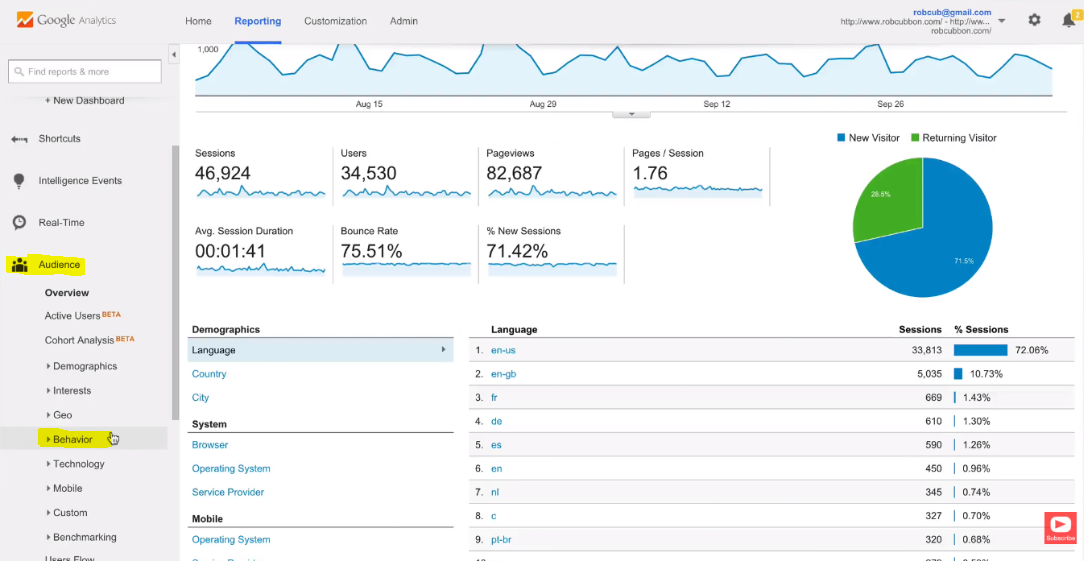
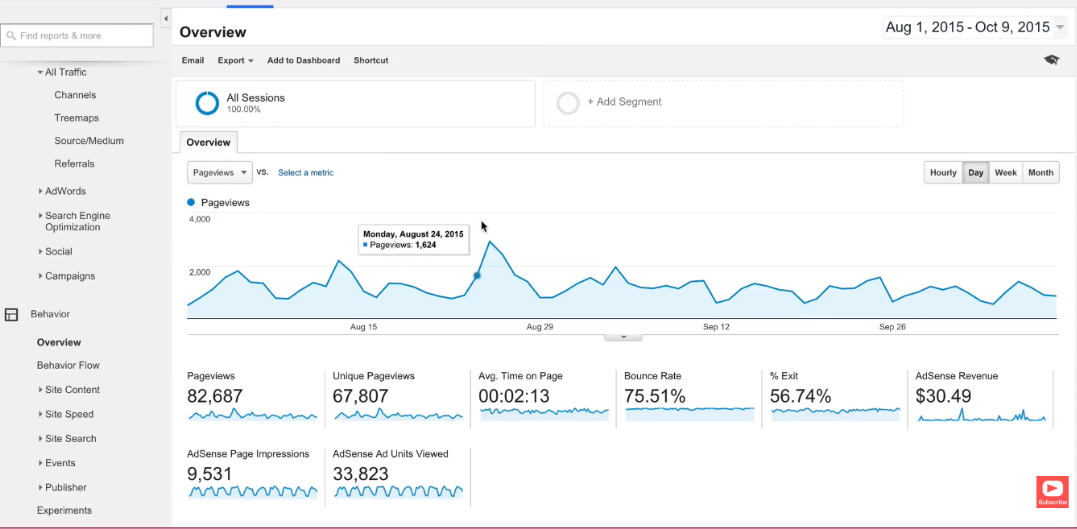
Now, look into the “Audience” and there’s lots of information here like whether they are from Demographics, Age, and Gender. Of course, you can’t be certain about much of this information because we are not sure about how Google knows the gender of everyone who is using their search engine. But you can certainly see the percentage on “Mobile” view and the percentage on the desktop. You can also see their behavior as of how many of them are new and how many of them return. But under the behavior tab, there is more information because this shows you what’s popular and what is not? Google sends the traffic to blog post titles and avenues that you are really interested in. This is how Google Analytics looks like of Home view as given below.
Conclusion
This is it, as you probably know Google Analytics is by no means the only web analytics solution out there. But currently, the most popular one because it’s completely free. It gives you a lot of capabilities to actually analyze the data which are mostly found in paid tools. You can perform data analysis easily when you compare any data to another website. Because the view of the data is the same as Google Analytics. A lot of people and a lot of websites have installed it nowadays.
I excel when it comes to making bespoke data dashboards and visualizations that users and clients absolutely love. Sharing about things I enjoy doing is my hobby, whether it's about a project, collaboration, feedback, or just simple how-to guides about visualization.
If you have something to ask or share, I'd love to hear from you!
- Business Intelligence Vs Data Analytics: What’s the Difference? - December 10, 2020
- Effective Ways Data Analytics Helps Improve Business Growth - July 28, 2020
- How the Automotive Industry is Benefitting From Web Scraping - July 23, 2020
1 thought on “How You Can Utilize Your Website Traffic Data?”