Excel is a way of representing how different data analyses can be made when applied in different programs. Using R Programming can do all kinds of statistical models, including linear regressions, histograms, cluster analysis, and prediction methods to analyze data in ways that we can’t do in Excel.
In general, Excel is based on the physical spreadsheet or accountant’s ledger. This is regarded as a large piece of paper with rows and columns. Records were stored in the first column on the left, calculations on those records were stored in the boxes to the right, and the sum of those calculations was totaled at the bottom.
Jump to Section
Text-based data analysis is different
- In R, data and computation are separate. You have one file which stores the data, and another file that stores the commands which tell the program how to manipulate that data. This leads to a procedural kind of model in which the raw data is fed through a set of instructions and the output pops out the other side.
- In excel, the data is generally referenced by name. Instead of having a dataset that lives in the range of $A1:C$36, you name the dataset when you read it in and refer to it by that name whenever you want to do something with it.
Data Structures
Excel has only one basic data structure: the Cell. Cells are extremely flexible in that they can store numeric, character, logical, or formula information. The cost of this flexibility is unpredictability. For instance, you can store the character “6” in a cell when you mean to store the number 6.
The basic R data structure is a vector. You can think of a vector as a column in an Excel spreadsheet with the limitation that all the data in that vector must be of the same type. If it is a character vector, every element must be a character. If it is a logical vector, every element must be TRUE or FALSE. And, if it’s a numeric vector, you can trust that every element is a number.
R can handle very large datasets
Excel has a limitation per spreadsheet. It can have a limited amount of rows and columns, while R handles a larger amount of data.
R can automate and calculate much faster than Excel
Excel files can crash when they contain up to 20 tabs chock-full of data, including a Pivot Table. Naturally, the file crashes due to the fact that Excel is able to handle a good amount of data, but not that much. This creates a serious problem only when you start losing data when the file becomes unable to save when you add any more data to it.
R source code is reproducible
The source codes of R can be used repeatedly and with very different data sets in ways that Excel formulas and VBA source codes cannot. There are statistical source codes available that can be applied to any kind of dataset with only a few changes to the code and reference data. And they can be reapplied multiple times very easily.
R can be much more time-consuming and also limited in some cases. However, it is also loaded with an advantage that it shows the data and analysis, both parts separately, while Excel, on the other hand, shows them together (data within formulas).
This allows the user to view the data more clearly to correct any errors or see the progression of the data.
Community libraries worth of R source code are available to all
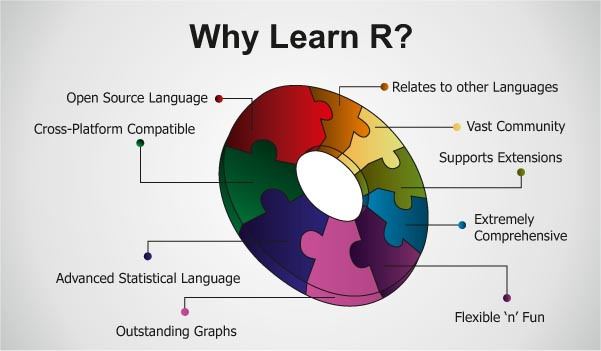
Nowadays, R has been growing in usage and popularity over the past several years. Users are adding new functions to the available packages and libraries are also increasing.
It allows any R users access to not only basic statistical functions, but also an increasing number of complex new functions that may be applicable to their data. Basically, it creates a community of R users who are extending their knowledge easily to other R users who may need a similar solution to their data.
R provides more complex and advanced data visualization
In general, excel can produce several types of basic graphs once you chop up and select the exact data you want to analyze.
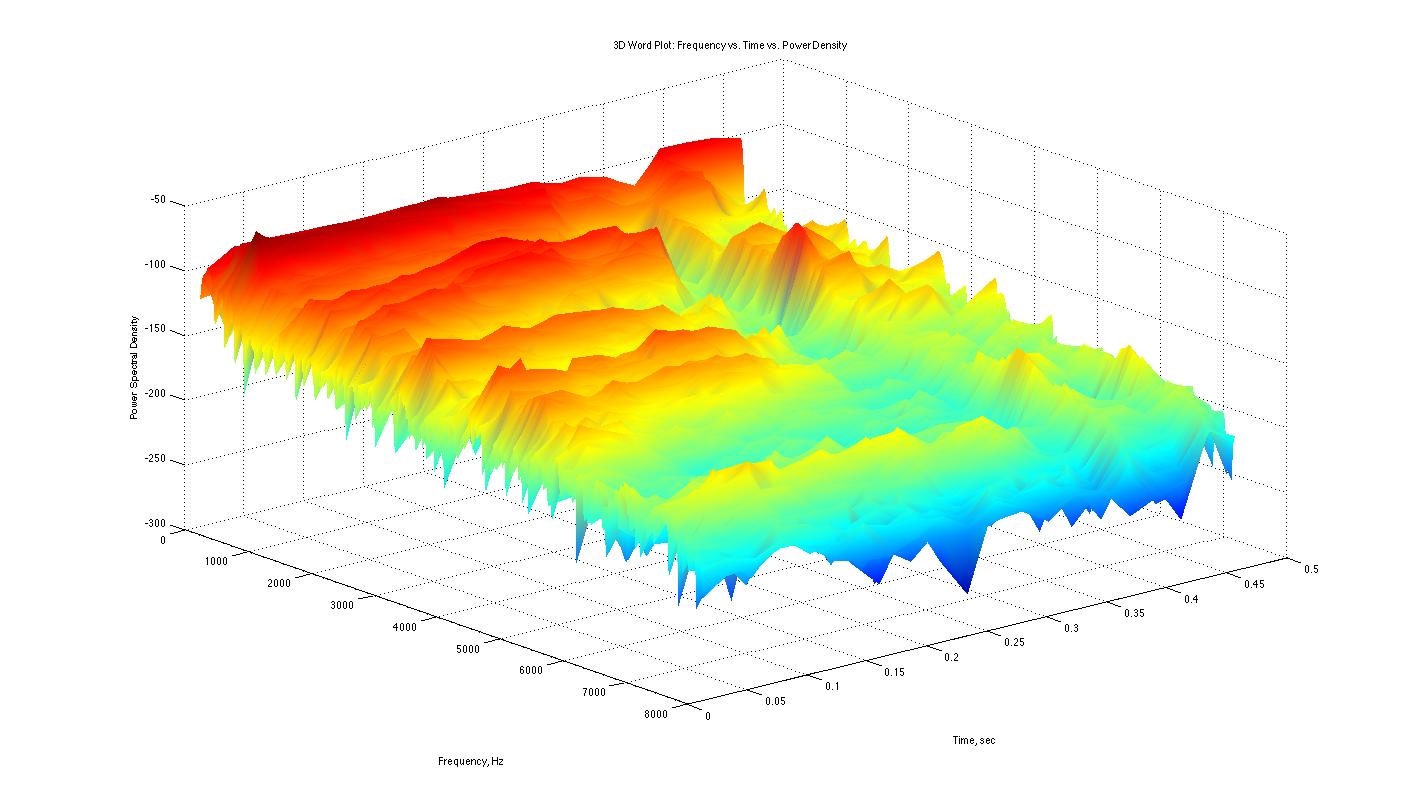
R, on the other hand, is designed to produce graphs much more easily without all the pre-graph work, as well as provide more types of graphs that you’d ever know what to do with.
Benefits of using R
Below are the benefits of using R:
R IS FREEWARE
R can be downloaded by anyone, anywhere, on any platform!
Easier Automation
R uses a scripting language rather than a GUI, so it’s much easier to automate things in R than in Excel. This can save a lot of time, especially when you plan to re-use the same analysis multiple times.
Faster Computation
Due to the automation provided by R scripts, many operations are much faster to perform in R than in Excel.
It Reads Any Type of Data
Basically R can read any type of data (.txt, .csv, .dat, etc). There are packages specifically designed to read JSON, SPSS, Excel, SAS, and STATA data files.
Easier Project Organization
Generally, in Excel, the projects are often organized in different tabs of the same file. This can make the Excel file slow, clunky, and difficult to navigate.
It is easier to keep a project organized when dealing with R scripts because different tasks or sub-projects can be stored in separate files stored in the same folder and linked together in the same project with RStudio.
Accuracy
Generally, researchers have shown that Excel and other spreadsheets show important inaccuracies in the case of basic analyses like linear regression while R was specifically designed for statistical analysis, so it is more precise and accurate for data analysis.
Advanced Statistics
R has more advanced statistics capabilities than Excel does. They also tend to be faster and more flexible.
Easier to Find and Fix Errors
Actually, R uses scripting rather than clicking, and allows comments and version control. One can see a history of the actions taken to achieve the result. This makes it easier to find and troubleshoot errors.
In Excel, however, errors can be hidden in formulas in cells that can be difficult to find. Spreadsheet errors have led to widely-publicized mistakes, including disastrous financial losses, faulty government policies, and the wrong drugs being given to cancer patients.
Humans make mistakes and mistakes in data analysis are inevitable, whether with spreadsheets or with R code. The bottom line is that it is quite easier to find and fix these mistakes in R than to do it in Excel, making it more likely that you’re getting an accurate result in R.
Final Words
I hope both the worlds of R and Excel are in a much broader light now for you. However, you can place your further queries in the comments section below.
- Business Intelligence Vs Data Analytics: What’s the Difference? - December 10, 2020
- Effective Ways Data Analytics Helps Improve Business Growth - July 28, 2020
- How the Automotive Industry is Benefitting From Web Scraping - July 23, 2020


