
Hello readers, I have come up with a new energizing topic called how to create graphs in the Android application. Here, I will direct you to make the graphs on Android so we should begin the work.
The graphs will make simpler to visually illustrate the relationships in the data and make to take the decisions easy based on that.
When we develop the apps like business apps, Fitness apps, Marketing apps or Bank apps one of the common UI components that we need to use is graph or chart.
We have distinctive kinds of Graphs and some of them are present here.
1. Line graph
2. Pie chart
3. Bar graph
4. Histogram
5. Scatter plot and etc.
Jump to Section
Create a Project
To execute the graphs in the Android application. Initially, we have to make a Project.
1. Open Android Studio on your pc.
2. Go to File menu->New->New Project
3. Set the application name as GraphsDemo.
4. Company domain: Your package name.
5. Then click on the Next button.
6. We are using the minimum SDK as Android 4.4 (KitKat).
7. Again tap on the Next button.
8. Pick the Activity type as Empty Activity, afterward click on the Next button.
9. Activity Name: MainActivity.
10. At last, click on the Finish button.
This will make your Android application Project named as GraphsDemo.
Add a library
1. Here, we have to add the graphview library to our project to create the graphs in our application.
2. Open the app-level build.gradle file in your project and the following dependency.
dependencies{
compile 'com.jjoe64:graphview:4.2.1'
}
3. Likewise, include the following in the project-level build.gradle file.
maven {
url "https://jitpack.io"
 }
AndroidManifest.xml
Here the final look of AndroidManifest file.
<?xml version="1.0" encoding="utf-8"?>
<manifest xmlns:android="http://schemas.android.com/apk/res/android"
    package="com.loginworks.graphsdemo">
    <application
        android:allowBackup="true"
        android:icon="@mipmap/ic_launcher"
        android:label="@string/app_name"
        android:roundIcon="@mipmap/ic_launcher_round"
        android:supportsRtl="true"
        android:theme="@style/AppTheme">
        <activity android:name=".MainActivity">
            <intent-filter>
                <action android:name="android.intent.action.MAIN" />
                <category android:name="android.intent.category.LAUNCHER" />
            </intent-filter>
        </activity>
    </application>
 </manifest>
Line Graph
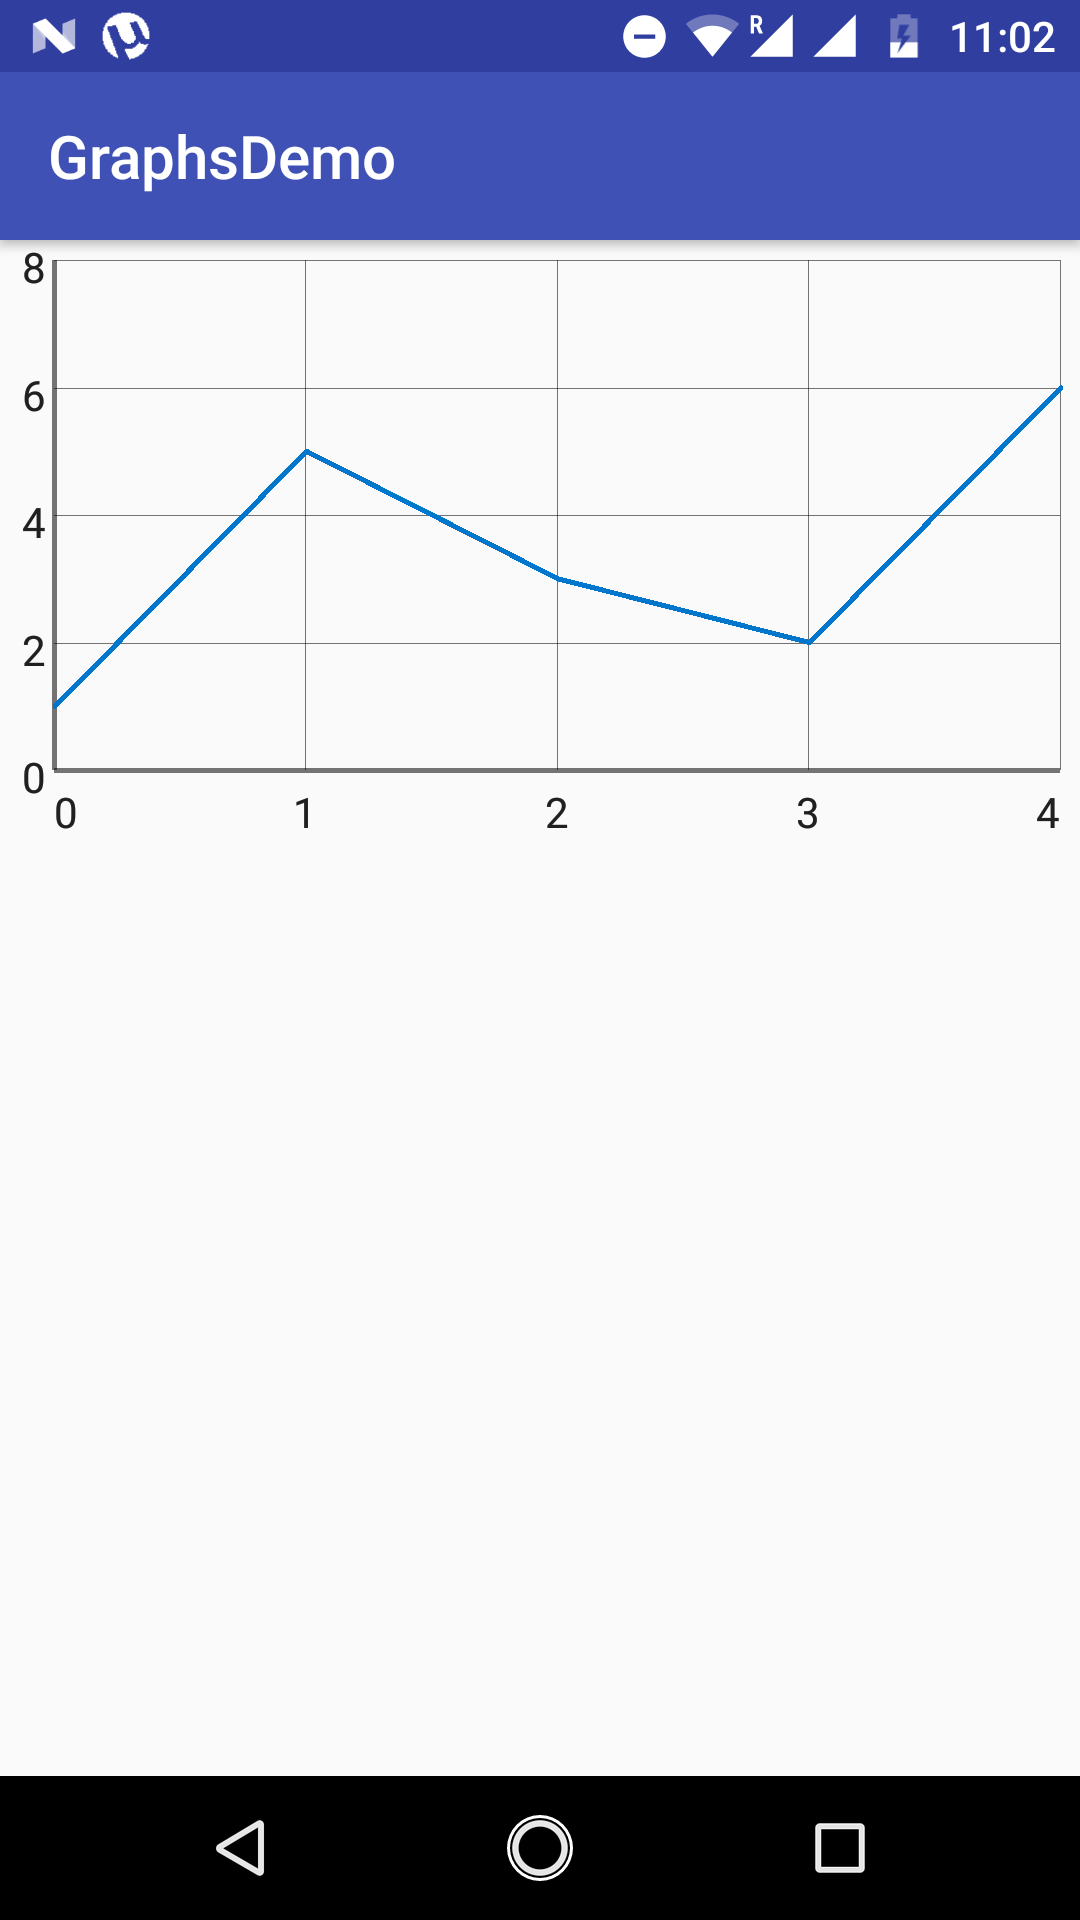
1. A line Graph is also called a line outline, here the data points are plotted and connected by a line in dot-to-dot design.
2. To display the line chart in the Android application we need to use the underneath elements in the layout file.
<com.jjoe64.graphview.GraphView
    android:layout_width="match_parent"
    android:layout_height="200dip"
    android:id="@+id/line_graph"/>
3. Next, initialize the line graph in your class by utilizing the following code.
GraphView linegraph = (GraphView) findViewById(R.id.line_graph);
4. Set the data in the graph by using DataPoint.
LineGraphSeries<DataPoint> lineSeries = new LineGraphSeries<>(new DataPoint[] {
        new DataPoint(0, 1),
        new DataPoint(1, 5),
        new DataPoint(2, 3),
        new DataPoint(3, 2),
        new DataPoint(4, 6)
 });
linegraph.addSeries(lineSeries);
5. For tweaking the Line Graph style view follow these steps.
a) Color: setColor() method is used to indicate the color of the line.
series.setColor(Color.GREEN);
b) Title: Allowed for changing the title of the graph using setTitle().
series.setTitle(“Line Chart”);
c) Thickness: To make the changes in the density of the line by using setThickness() method.
series.setThickness(8);
d) Data Point Radius: To set the radius of the data point using setDataPointRadius() method.
series.setDataPointRadius(10);
6. Here the complete picture of Line Graph.
Bar Graph
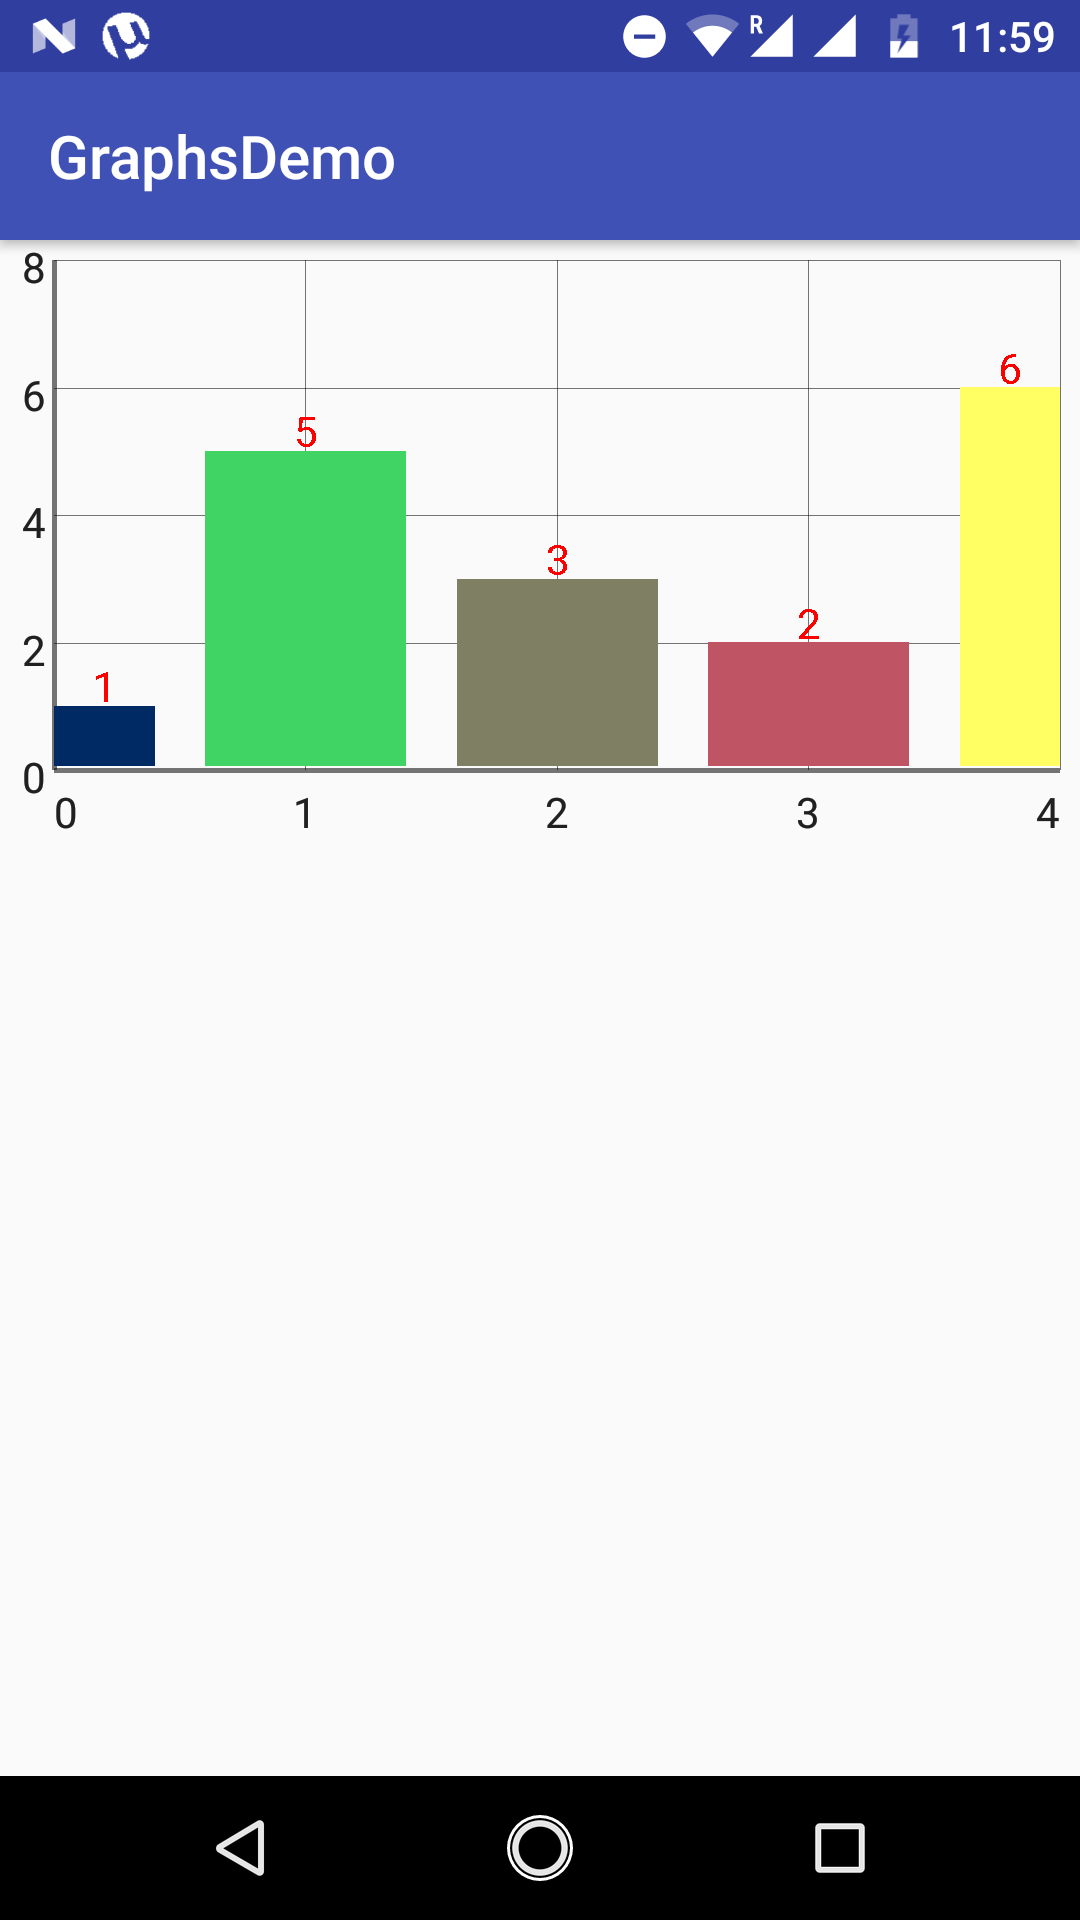
1. The Bar Graph is a graphical show of information with rectangular bars of various statures or lengths related to the values that they represent.
2. Include the below lines of code in Layout file to represent the Bar Graph in Android Application.
<com.jjoe64.graphview.GraphView
    android:layout_width="match_parent"
    android:layout_height="200dip"
    android:id="@+id/bar_graph" />
3. Initialize the Bar Graph in the activity class.
GraphView bar_Graph = (GraphView) findViewById(R.id.bar_graph);
4. Setting data to the Bar Graph.
BarGraphSeries<Data> barGraph_Data = new BarGraphSeries<>(new Data[] {
        new Data(0, 1),
        new Data(1, 5),
        new Data(2, 3),
        new Data(3, 2),
         new Data(4, 6)
 });
bar_Graph.addSeries(barGraph_Data);
5. setValueDependentColor() is used to define the color of the bars in reliance of the y-value.
barGraph_Data.setValueDependentColor(new ValueDependentColor<Data>() {
    @Override
    public int get(Data info) {
        return Color.rgb((int) info.getX()*255/4, (int) Math.abs(info.getY()*255/6), 100);
    }
});
6. To change the spacing between two bars we utilize the setSpacing() method.
barGraph_Data.setSpacing(20);
7. To draw the values of the highest point of the bar and set the color of the values.
barGraph_Data.setDrawValuesOnTop(true);
barGraph_Data.setValuesOnTopColor(Color.RED);
8. Finally, the result of the designed Bar Graph is below.
Points Graph
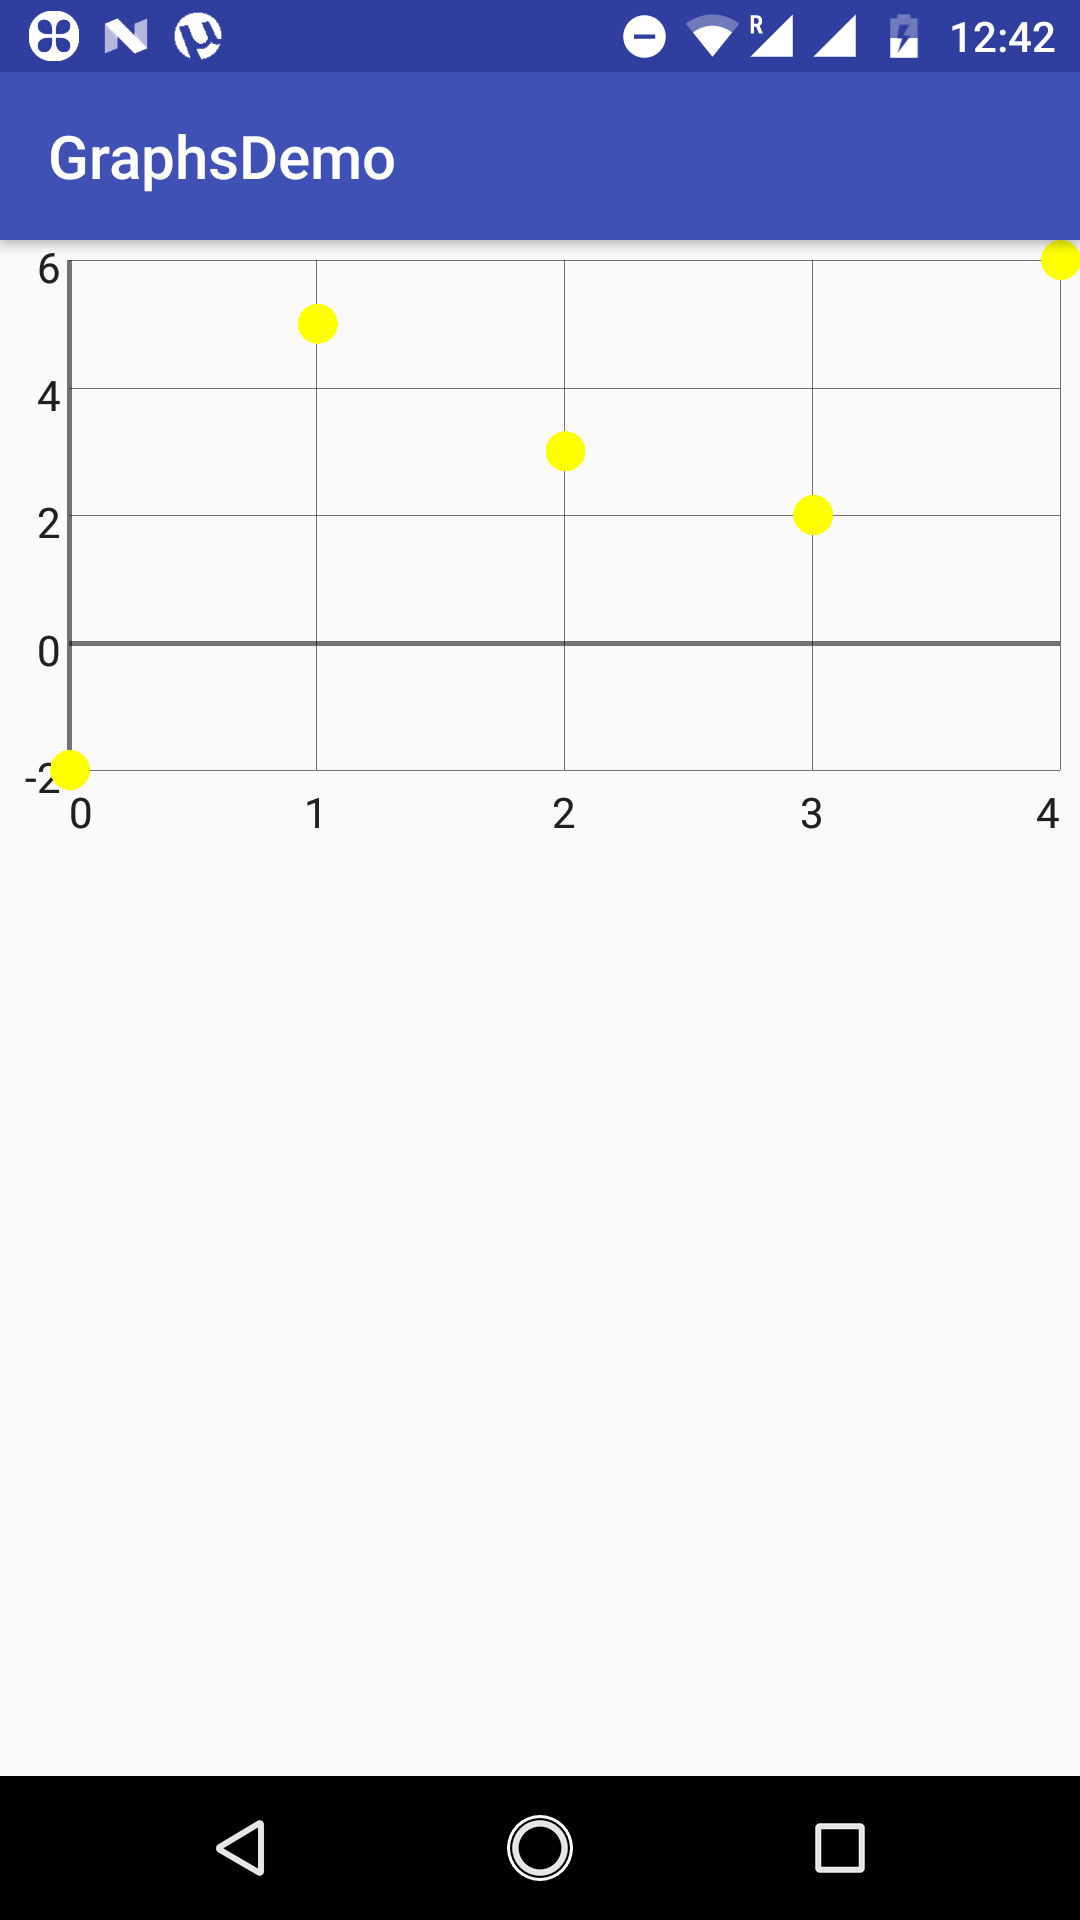
1. The Points Graph is used to display the data in the form of points.
2. Add the following to the Layout file to display the view of Points Graph.
<com.jjoe64.graphview.GraphView
    android:layout_width="match_parent"
    android:layout_height= "200dip"
    android:id="@+id/points_graph" />
3. Initialize the Points Graph in MainActivity class.
GraphView points_Graph = (GraphView) findViewById(R.id.points_graph);
4. Next, set the data in Points Graph.
PointsGraphSeries<DataPoint> pointsGraph_Data = new PointsGraphSeries<>(new DataPoint[] {
         new DataPoint(0, -2),
         new DataPoint(1, 5),f
         new DataPoint(2, 3),
         new DataPoint(3, 2),
         new DataPoint(4, 6)
 });
points_Graph.addSeries(pointsGraph_Data );
5. To change the shape of the point from hover shape to rectangle use the below code.
pointsGraph_Data.setShape(PointsGraphSeries.Shape.RECTANGLE);
6. To change the color of the point using setColor() method.
pointsGraphData.setColor(Color.YELLOW);
7. The example design of Points Graph as shown here.
Pie Graph
1. To build a Pie graph we are using another library called as a MpAndroidChart library.
2. Add the library to a build.gradle file to use the library features.
dependencies {
  compile ' com.github.PhilJay:MPAndroidChart:v2.0.9'
}
3. It is also a type of graph in which the circle is divided into a number of sectors.
4. Add the below element in Layout file to create the Pie Chart in the application.
< com.github.mikephil.charting.charts.PieChart
    android:id="@+id/pie_chart"
    android:layout_width="match_parent"
    android:layout_height="match_parent" />
5. we need to initialize the pie chart.
PieChart pie_Chart = (PieChart) findViewById(R.id.pie_chart);
6. Define the x-axis values in the pie chart.
ArrayList<String> xaxisValues = new ArrayList<String>();
xaxisValuess.add("January");
xaxisValues.add("February");
xaxisValues.add("March");
xaxisValues.add("April");
xaxisValues.add("May");
xaxisValues.add("June");
PieData data = new PieData(xaxisValues, dataSet);
7. To set the y-axis data in the pie chart, we need to create the DataSet as follows.
ArrayList<Entry> yaxisvalues = new ArrayList<Entry>();
yaxisvalues.add(new Entry(8f, 0));
yaxisvalues.add(new Entry(15f, 1));
yaxisvalues.add(new Entry(12f, 2));
yaxisvalues.add(new Entry(25f, 3));
yaxisvalues.add(new Entry(23f, 4));
yaxisvalues.add(new Entry(17f, 5));
pie_Chart.setUsePercentValues(true);
PieDataSet pieData = new PieDataSet(yaxisvalues, "Pie Chart");
8. To display the pie chart in the form of a percentage then pass newPercentFormatter as a parameter.
data.setValueFormatter(new PercentFormatter());
9. For setting the data we need to pass the pie data into setData() method.
pie_Chart.setData(data);
10. Here the library MpAndroidChart gives the predefined color templates.
pieData.setColors(ColorTemplate.COLORFUL_COLORS);
11. To make the changes of size and color of the text, Use the following code.
data.setValueTextSize(13f);
data.setValueTextColor(Color.DKGRAY);
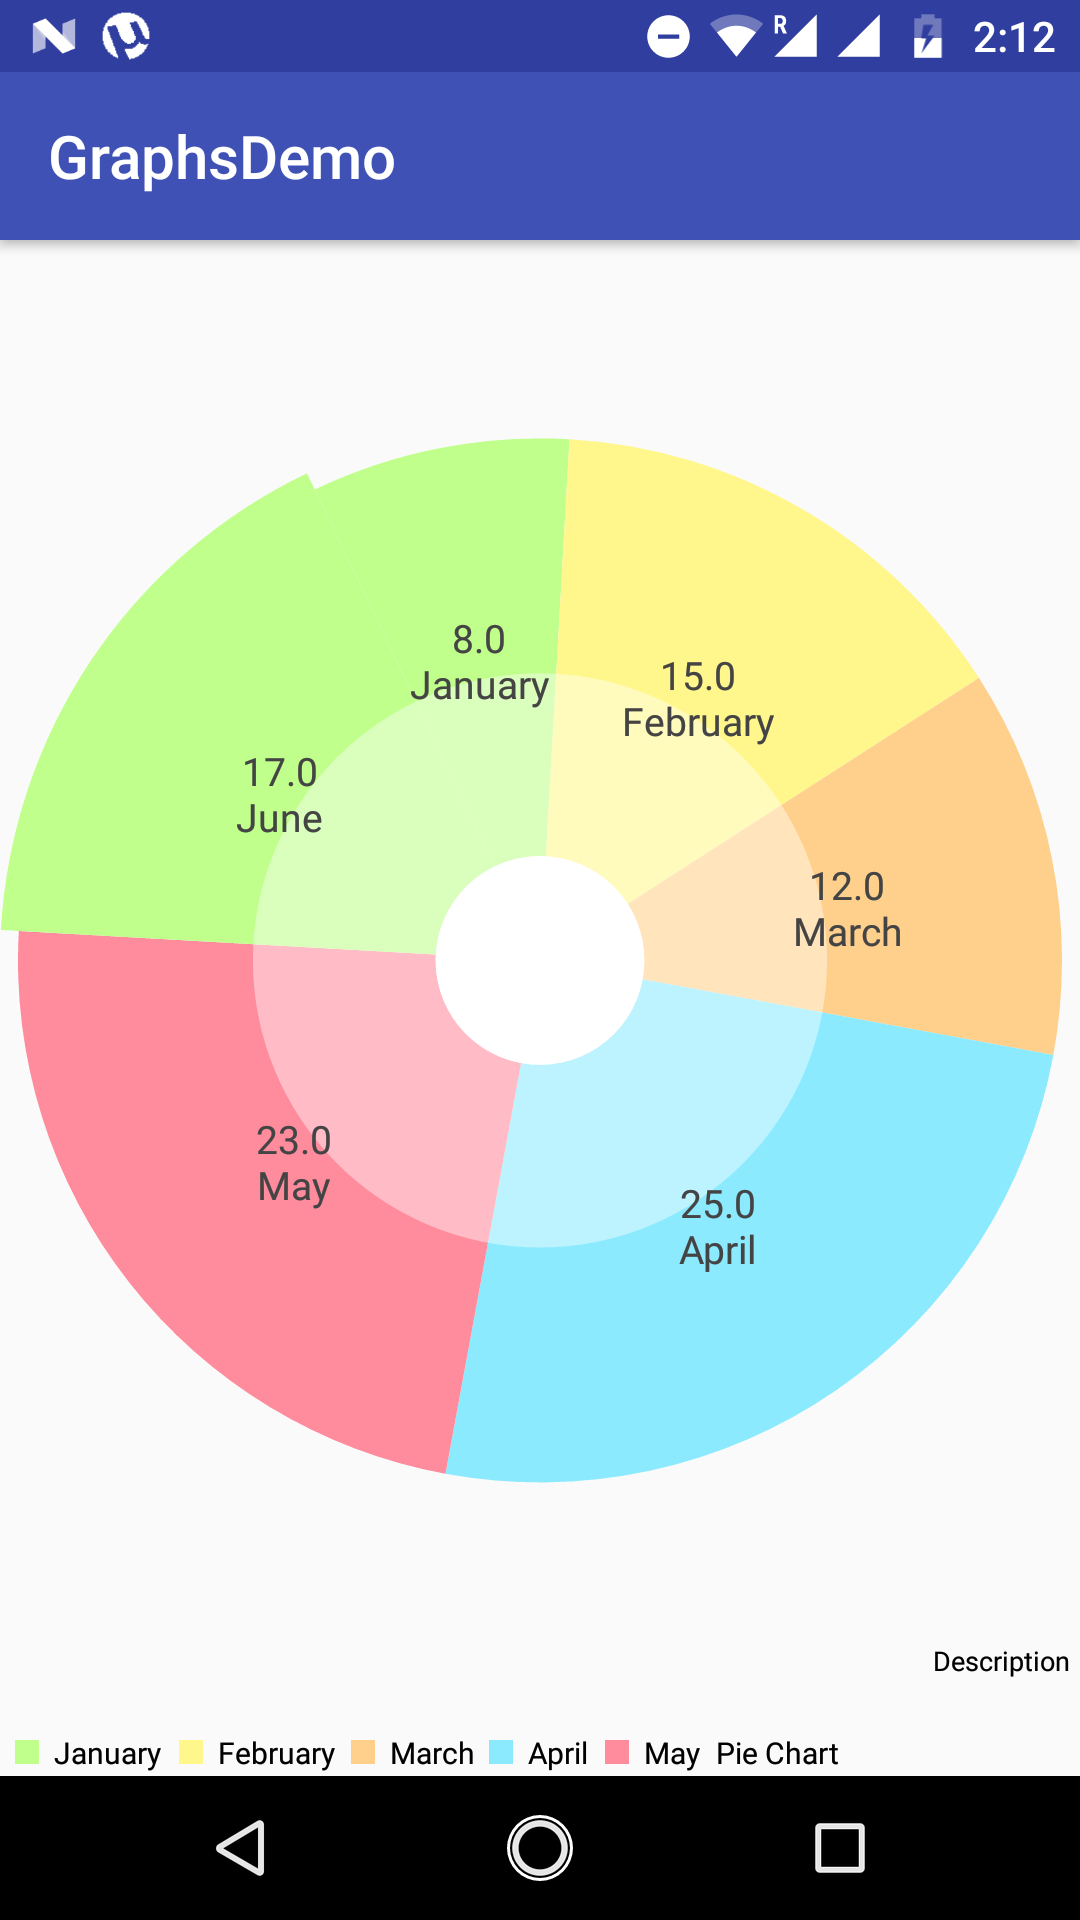
12. we have also the option of enabling or disabling the hole in the middle of a pie chart and to control the radius of the hole.
13. If we disable the hole by setting pie_Chart.setDrawHoleEnabled(false) method. We get the following visual.
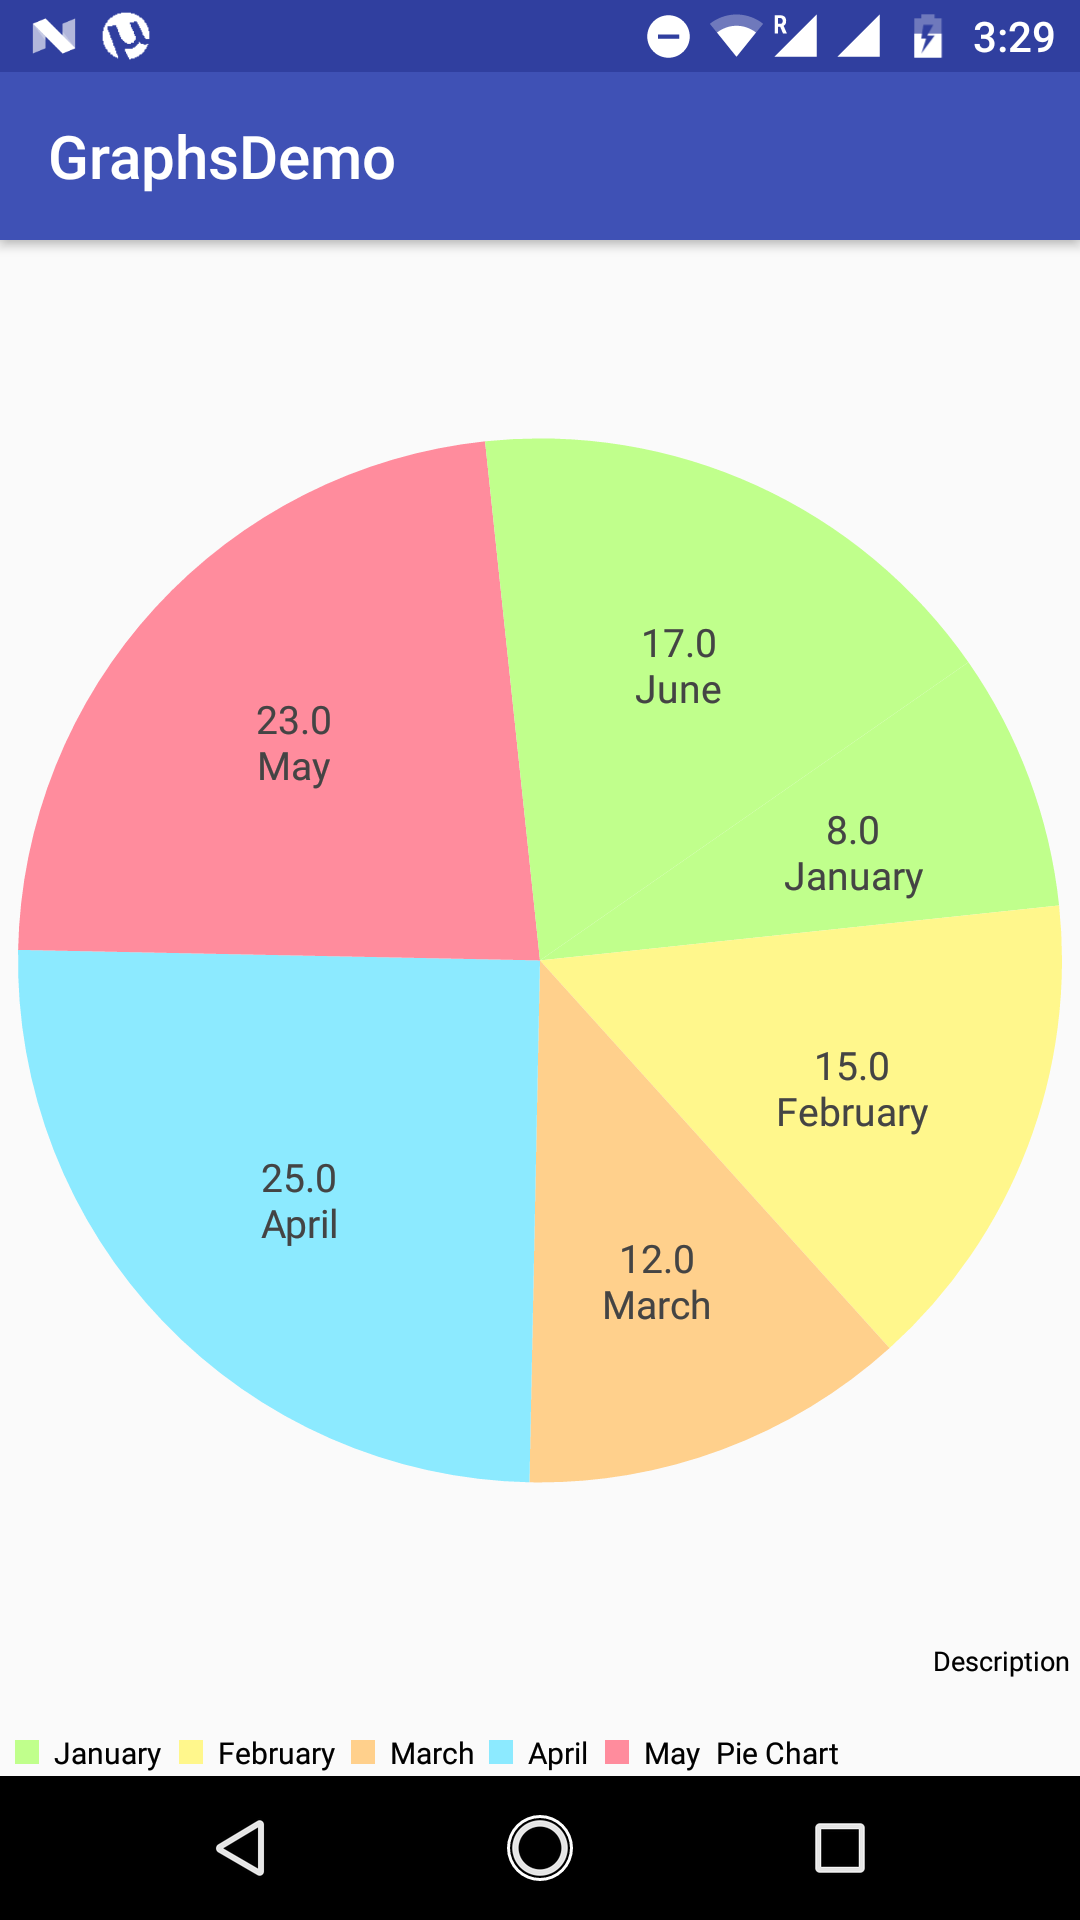
14. The following image is the pie graph with the hole is enabled in the center.
pie_Chart.setDrawHoleEnabled(true);
pie_Chart.setHoleRadius(30f);
pie_Chart.setTransparentCircleRadius(30f);
Animate the graph view
we can also animate the graph view by using the method animateXY() which will animate from both the axis of the chart or if we want to animate only one of the axis then use animateX() or animateY() method and specify the duration (in milliseconds) of the animation as a parameter.
pie_Chart.animateXY(1500, 1500);
or
pie_Chart.animateX(1000);
or
pie_Chart.animateY(1000);
Summing Up
Finally, we finished the task of creating distinctive types of graphs in Android Application. Hope, this blog will be helpful for you while creating graphs in your Android applications. If you have any suggestions or queries, please feel free to post your queries below in the comments section. Thanks!
- LinkedIn Scraper | LinkedIn Data Extractor Software Tool - February 22, 2021
- Is Web Scraping Legal? - February 15, 2021
- What Is Data Scraping? - February 10, 2021
ArrayList xaxisValues = new ArrayList();
xaxisValuess.add(“January”);
xaxisValues.add(“February”);
xaxisValues.add(“March”);
xaxisValues.add(“April”);
xaxisValues.add(“May”);
xaxisValues.add(“June”);
PieData data = new PieData(xaxisValues, dataSet);
What is “dataSet” in this as I am unable to find this term…..also my app is crashing as I am unable to resolve this.
How to make graph continuously for corresponding bluetooth values sent from arduino to android app?