As we all know, big data is growing day by day, so do you know that what are the different reasons behind this growth. The answer is ‘Data’ and ‘Data’ only. In big data applications, you can derive values from its data. Now, there again a question arises that how you can derive value from data that helps in big data growth. So the answer is there are a number of different Data analytics, which work as the backbone of a big data application.
Jump to Section
Data Analytics
Data analytics is generally used to discover useful information from a huge heap of various data which you collect from different sources. It generally segregates data in different patterns just to find out useful information. Data analytics works around fourth ‘V’, of Big Data application. In addition, we can refer, ‘Value’ as ‘importance’ of its data.
There are following Data Analytics to process data and fetch useful information:
- Descriptive
- Diagnostic
- Discovery
- Predictive
- Prescriptive
All above data analytics are divided into two categories of Data Analytics: Core and Advanced. Core category contains Descriptive analytics and, Diagnostic analytics. Core is also referred as Traditional data analytics. Whereas other three, i.e., Discovery analytics, Predictive analytics and Prescriptive analytics come under the Advanced category.
Descriptive Analytics
Descriptive analytics belongs to all past data related to a business, market or research. This data enables you to understand all statistics from starting of business to till date. To collect data, in this category, researchers or system has to collect historical data. In addition to this, you can collect the historical data by finding out answers to few questions as given below:
- What happened and why?
- What is happening right now and Why?
Above questions help in collecting data to describe the past situations.
In market, that kind of data is easily available and can be processed easily. Most of the data lie in descriptive analytics category. For example, each company or organization maintains many reports of different departments to collect their statistics in monthly, quarterly, and yearly basis. This is also an example of descriptive Analytics. Hence, there are many things in descriptive analytics category, few of them are:
- Yearly variance in the total stock of a company’s inventory
- The average amount of money spent on marketing schemes
- Yearly changes in company revenue.
- Quarterly up and downs in product sales.
Diagnostic Analytics
While collecting descriptive data, analysts also focus on the reason behind that descriptive data. In other words, we can say that analysts have to find out the answer to a question that ” Why did it happen?”. To get the answer to this question, they examine different statistics collected for descriptive analytics.
Diagnostic analytics helps either to find out the solution to a problem or to improve the predictive analytics. There is a number of techniques such as 5 whys, drill-down and fishbone are used to gather diagnostic analytics.
Analysts use automatically recorded data in different machines, vehicles, software etc. to capture diagnostic analytics. There are few examples of sources where data captured for diagnostic analytics:
- Logs files in an application/software
- Black-box in an aircraft
Discovery Analytics
Discovery analytics refers to special facts that have an impact on descriptive data. Analysts get discovery analytics with the study of both descriptive as well as diagnostic analytics. In other words, Discovery analytics can be referred as “Learning from data.”
Discovery Analytics generally is something important and has a relation with data sets collected. Basic examples of Discovery Analytics are:
- Important Facts
- Impacted Areas
Predictive Analytics
As its name describes, it is something to predict few facts of the future condition. On the basis of descriptive analytics collected for past experiences, researchers are able to find out few scenarios that might happen in future.
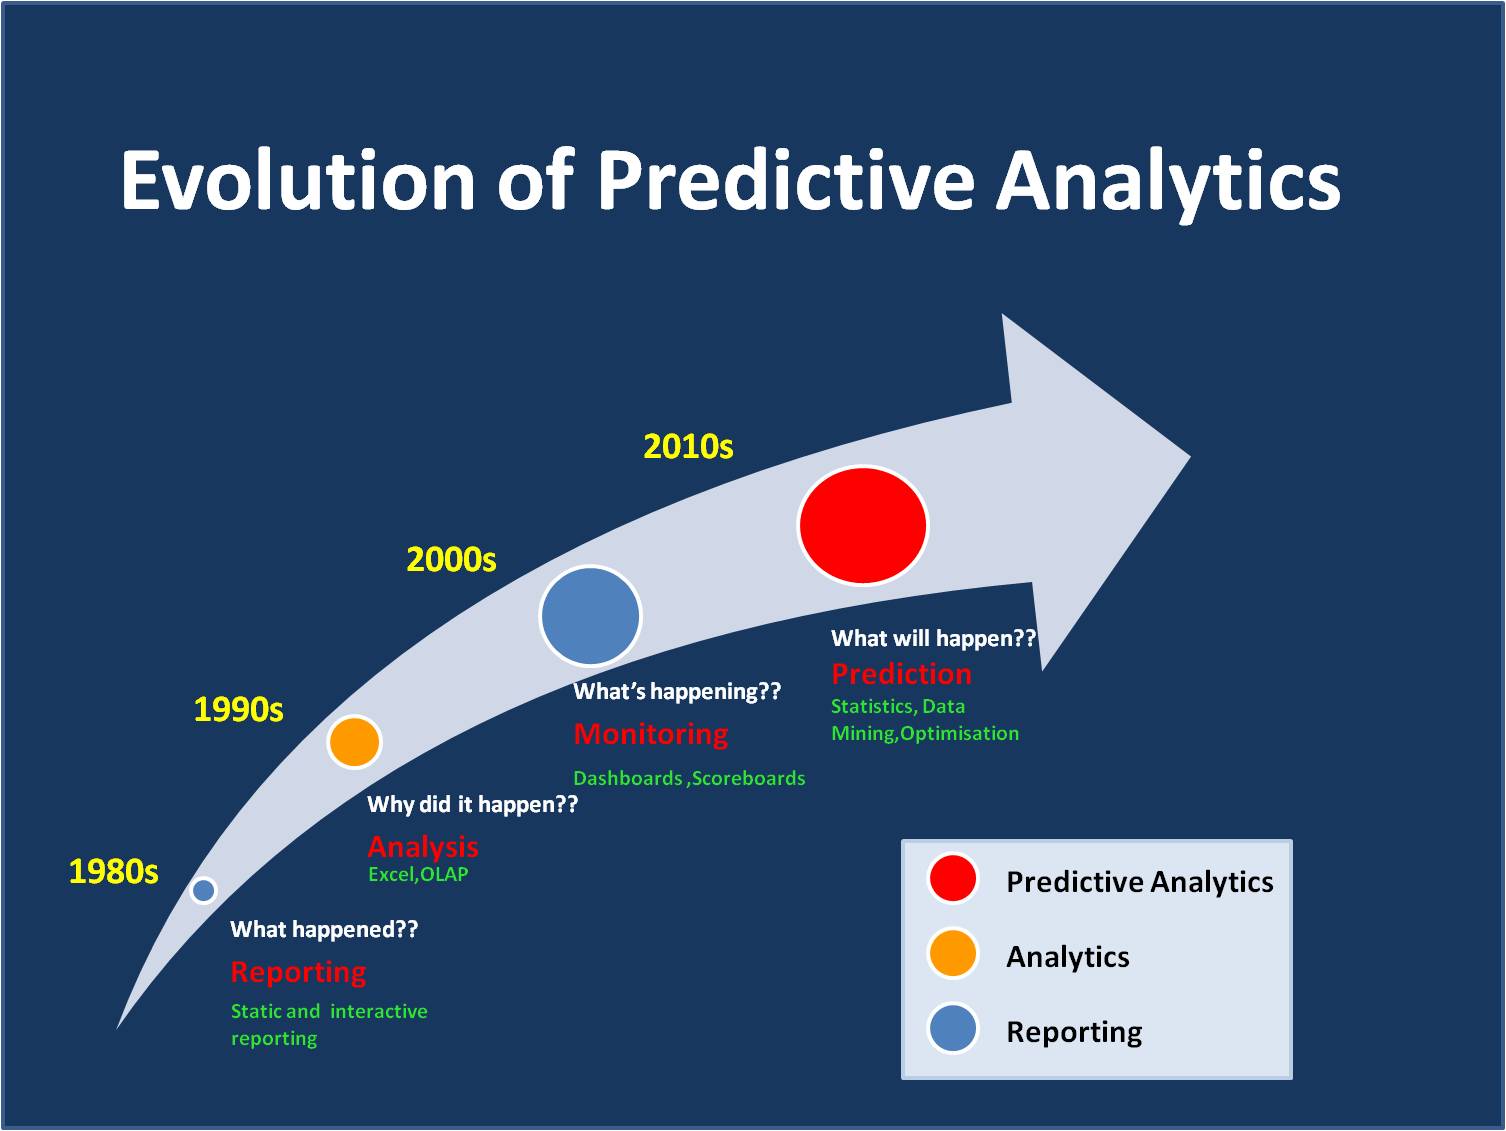
Research analyst can easily identify the short term predictions based on historical data captured in organizations. Most of the predictions lie in two categories as given below:
- What is likely to happen
- What is the reason behind those would be conditioned?
Prescriptive Analytics
Prescriptive analytics provides the best choice for all possible outcomes in a certain situation. In other words, we can say that Prescriptive analytics is a set of rules and recommendation to follow in a situation. Due to having a set of rules, it helps in making decisions. Moreover, it also provides information related to all possible directions to go further. Analysts work on the following questions to identify Prescriptive analytics:
- What my options are?
- What should I do for each option?
Prescriptive Analytics provides more options rather than Predictive analytics. As a result, prescriptive analytics help to identify the more future predictions and also provide reasons behind its all recommendations. Although, Prescriptive Analytics is complex to implement yet it provides a number of solutions for making a decision. Few organizations adopt prescriptive analytics to get an advantage of its data in especially making decisions.
Most of all industries, where Prescriptive analytics is used, are:
- ‘Healthcare domain’, to manage focus treatment of a large number of patients
- ‘Production Houses’ to optimize productions, sales, and inventories
Conclusion
Data Analytics is a deeper look at data rather than data itself. As a result, all these data analytics help in making a proper and on time decision. Each Data Analytics has different objectives but main motive of all models is to fetch out all useful information from all directions of single data available in the system. Descriptive, Diagnostic and Discovery analytics help to identify and maintain Predictive and Prescriptive analytics. Hence, all analytics help you to grow your business.
I excel when it comes to making bespoke data dashboards and visualizations that users and clients absolutely love. Sharing about things I enjoy doing is my hobby, whether it's about a project, collaboration, feedback, or just simple how-to guides about visualization.
If you have something to ask or share, I'd love to hear from you!
- Business Intelligence Vs Data Analytics: What’s the Difference? - December 10, 2020
- Effective Ways Data Analytics Helps Improve Business Growth - July 28, 2020
- How the Automotive Industry is Benefitting From Web Scraping - July 23, 2020