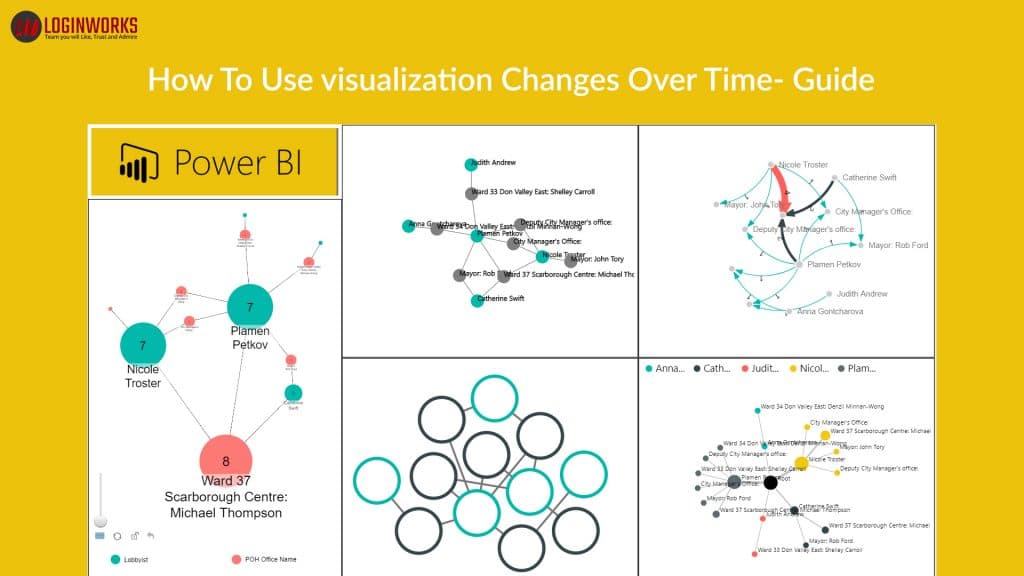
INTRODUCTION:
Data Visualization helps in representing the data and information by using visual elements like Statistical graphs, plots, information Graphics, maps, charts and other similar tools to understand and communicate information clearly and efficiently.
Hence, In this article, I will be discussing further on the different ways to represent Data using the Data Visualization tool.
As in the market, there are many tools that are available for data visualization such as Tableau, Power BI, Quick view, Rapidminor etc. However, For now, i will be using Power BI tool for Data visualization, to explain you more on this topic.
How does Visualization Tool help in reports?
Are you dealing with data? Well, you must have come across a variety of Time- Based Data. Here’s, when we need the visualization tool to show the changes in Data depending on the type of information we are looking for.
This blog would help you understand and figure out what type of visualization to use in order to view the accurate report.
Below are some example of visualization Charts :
Jump to Section
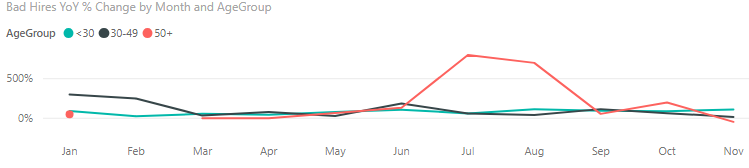
Line Charts:
Let’s begin initially with The Line Chart. As shown below in the image.
 Line chart will work for a large portion of your time arrangement information.
- Utilize it when you have a considerable measure.
- You can Place numerous time arrangement on one chart.
- You may use a mark to highlight the data information, focusing with squares, circles, or none at all.
- Fundamentally, in case you are not sure as what to utilize, then, the line chart will work typically to do this trick.
 Line chart will work for a large portion of your time arrangement information.
Scatterplots:
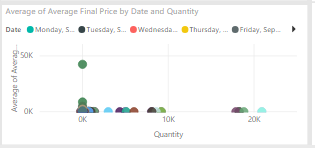
- Scatterplots charts will work properly in scenarios where you have the maximum amount of data points.
- Since the pointers are little, so, it doesn’t work properly when you have less amount of points.
- Scatterplots charts also work well when your estimations or measurement aren’t pleasantly organized.
- For instance, if your estimations/ measurement aren’t similarly divided, a line chart most likely wouldn’t work.
Bar Chart:
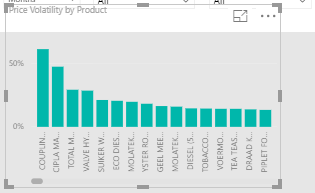
- Bar Chart works best for time arrangement when you’re managing a different point in time (rather than more continuous information).
- They will in general work better when you have information points that are equally separated in time.
- Bar chart used for the most trending chart in any visualization, this is very clear and easily understandable.
Stacked Bar Chart:
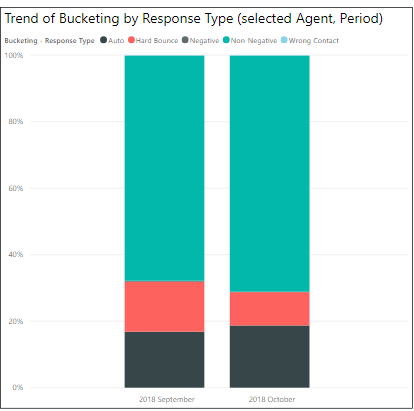
- Similarly, with the Stacked bar chat, you would use this bar chat when you have two different types of categories (subsequently the stacking).
- The stacks define to a significance in the summation of parts.
- Try not to stack if the parts don’t go together.
Stacked area chart:
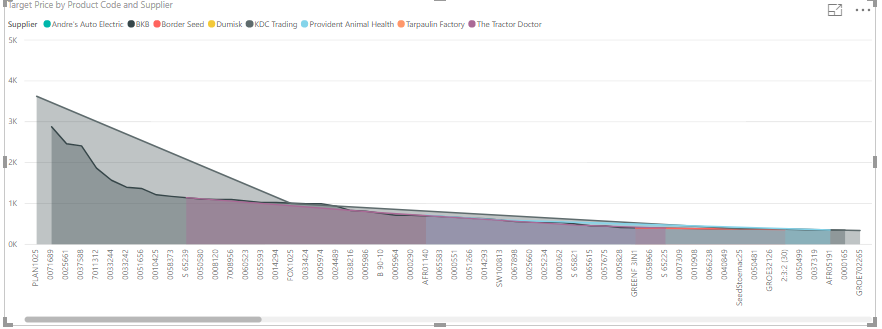
- We can say The stacked area chart is the stacked bar’s more versatile sibling.
- Suppose if there are a huge amount of data points at a particular time; However, there is insufficient space for a bunch of bars, then, we can use a stacked bar chart.
Bubble Chart:
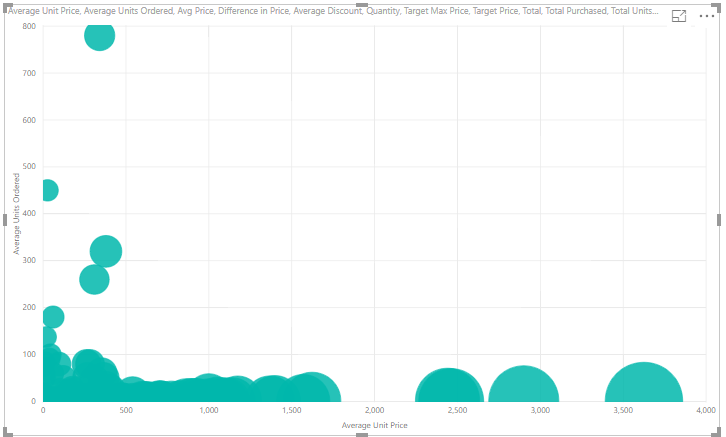
- The Bubble chart is used for best visualization chart in Power BI.
- You can see the count wise details in this chart.
- You can change the colors of bubbles to make an attractive visual report.
- It is easy to understand and easy to create.
- This is the most important chart for understanding the details in the visual form of data
Color Scale:
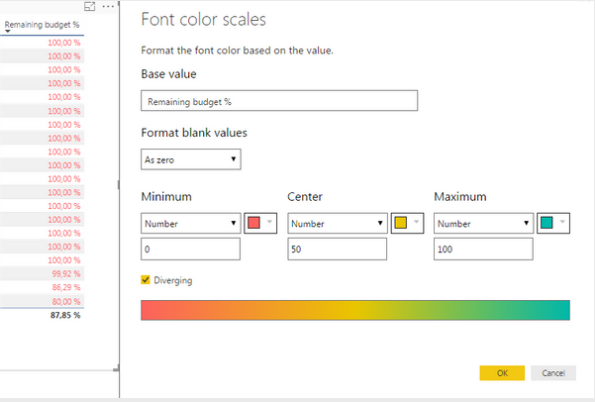
- The Color Scale Chart is used to show the changing tends underutilized.
- It’s less demanding to see contrasts in height than it is to see contrasts in shades of dark, yet in case, you’re constrained by space or need to demonstrate.
- Shading can be a decent arrangement.
- The fundamental difficulties with shading, that should assume to be a play in the structure design procedure are usually while picking shading scale and managing the little bit of the population who is visually challenged.
TreeMap:
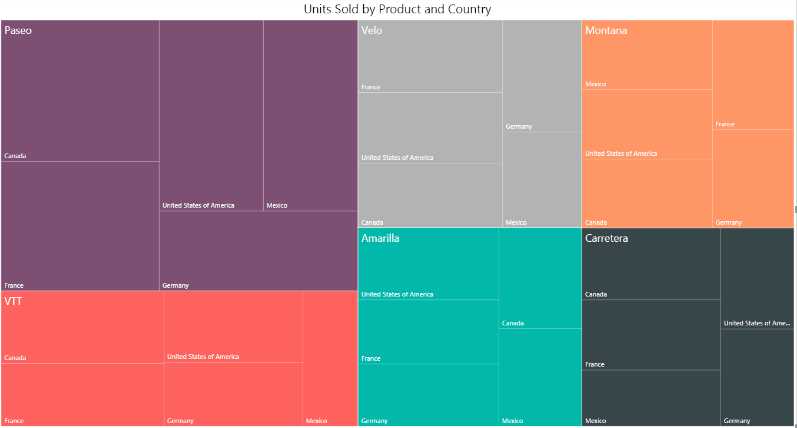
- Treemaps show progressive information as an arrangement of settled square shapes.
- Each dimension of the chain is demonstrated by a square shape (frequently called a “branch”) containing different square shapes(“clears out”).
- The space inside every square shape is designated dependent on the value being measured.
- Also, the square shapes are organized in size from the upper left (biggest) towards the base right (smallest).
Funnel:
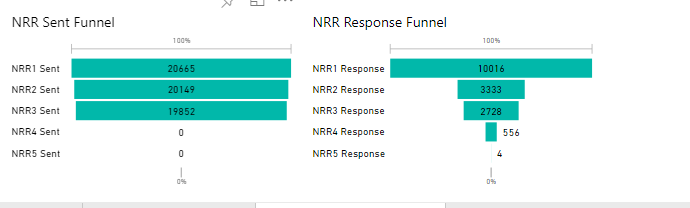
- Funnel graphs represent to phases of a linear procedure and the stream of things through that procedure.
- Having a representation of the procedure enables you to assess its health and distinguish potential bottlenecks.
- The best example of a Funnel diagram is a visualization of a business Funnel tracking clients through their purchasing journey.
Map Charts:
Power BI has full integration with Bing Maps to represent Map Chart.
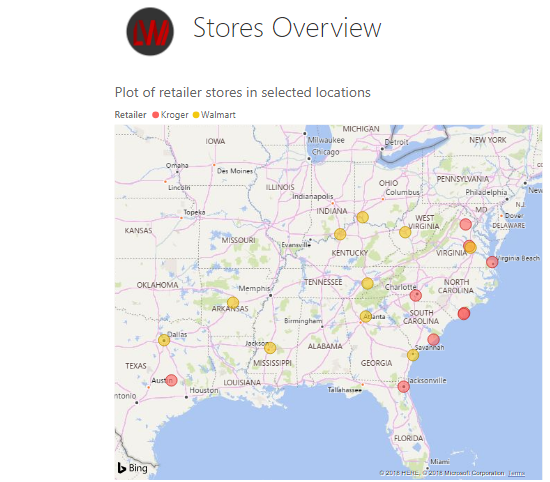
- Map Chart is ideal for showing both relevant and quantitative information.
- That chart is important to display the physical areas.
- For instance, you could break down the current year according to the areas showing the signs of improvement comprehension of which stores are best.
- Bubble maps can also be used to break down the data as category wise to show multiple results for the same location.
- Power BI additionally includes filled maps (choropleths) and ArcGIS maps to show geological information in various ways.
WaterFall Model:
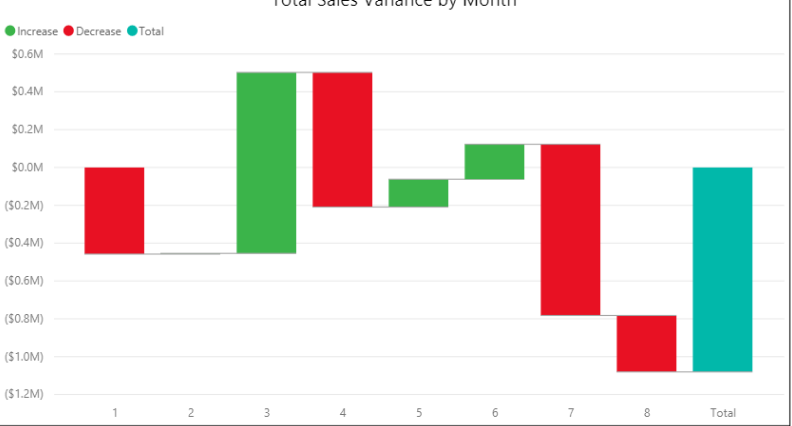
- The Waterfall Model Graphs demonstrate changes in an initial value after some time.
- These type of Graphs are extremly helpful when following how a value is influenced by positive and negative changes.
Conclusion:
In the above article, i have given you an overview on some of the visualizations graphs which are available in Microsoft Power BI. Hence, With this, we come to an end of this tutorial on “How To Use visualization Changes Over Time- Guide”. I hope this will help you to improve your knowledge to work on Visualization Graphs.
However, suggestions or queries are always welcome, so, do write in the comment section.
Thank You for Learning!!!
- What Products Should You Sell on Amazon? - November 18, 2020
- 10 Reasons Why You Should Start Selling on Amazon - October 22, 2020
- Comparative Study of Top 6 Web Scraping Tools - September 3, 2020