Data Summarization is a simple term for a short conclusion of a big theory or a paragraph. This is something where you write the code and in the end, you declare the final result in the form of summarizing data. Data summarization has the great importance in the data mining. As nowadays a lot of programmers and developers work on big data theory. Earlier, you used to face difficulties to declare the result, but now there are so many relevant tools in the market where you can use in the programming or wherever you want in your data.
Jump to Section
Why Data Summarization?
Why we need more summarization of data in the mining process, we are living in a digital world where data transfers in a second and it is much faster than a human capability. In the corporate field, employees work on a huge volume of data which is derived from different sources like Social Network, Media, Newspaper, Book, cloud media storage etc. But sometimes it may create difficulties for you to summarize the data. Sometimes you do not expect data volume because when you retrieve data from relational sources you can not predict that how much data will be stored in the database.

As a result, data becomes more complex and takes time to summarize information. Let me tell you the solution to this problem. Always retrieve data in the form of category what type of data you want in the data or we can say use filtration when you retrieve data. Although, “Data Summarization” technique gives the good amount of quality to summarize the data. Moreover, a customer or user can take benefits in their research. Excel is the best tool for data summarization and I will discuss this in brief.
Data Summarization in Excel
You can make the summary of the data in excel with ease and in a less time. There are so many ways to mining the data in excel, but I tell you the very simple formula for summarizing the data. First thing, we need a table as follows,
Data Summarization with SUMIF()
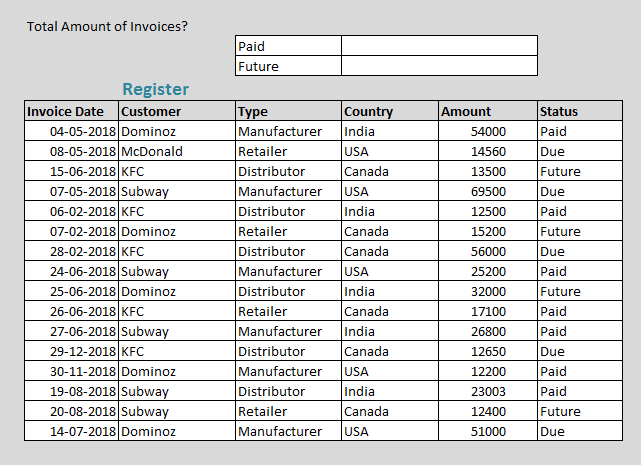
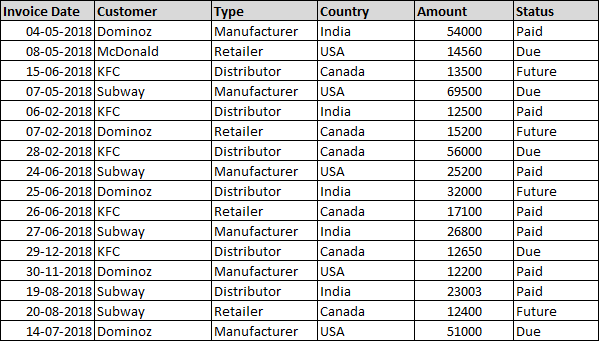
Now, look in the table name Register which contains six columns such as Invoice Date, Customer, Type, Country, Amount, and Status. We have already inserted random data for our ease. Now, I want total amount of ‘Paid’ and ‘Future’ in the table. So, let’s understand with an example of SUMIF formula as follows,
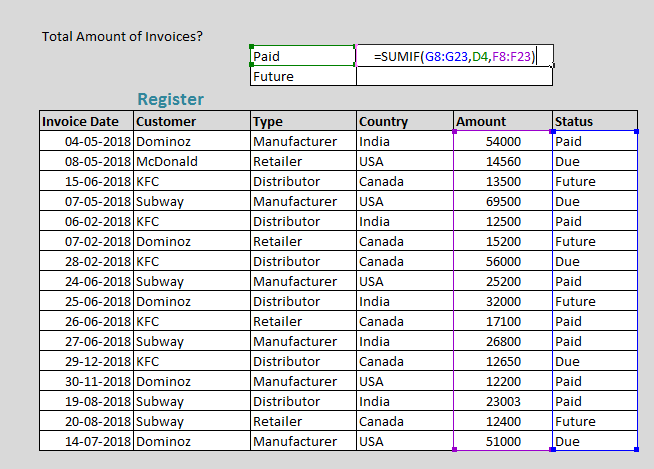
In the output, we used formula SUMIF, now see the formula explains (Range, Criteria, Sum_Range) as arguments.
Arguments
- Range: It selects the range from where you want to retrieve the string or number value.
- Criteria: It selects particular criteria in the range.
- Sum_range: It selects the range from where you need the data or amount in the table.
Once you type the formula then press Enter key and get the result as follows.
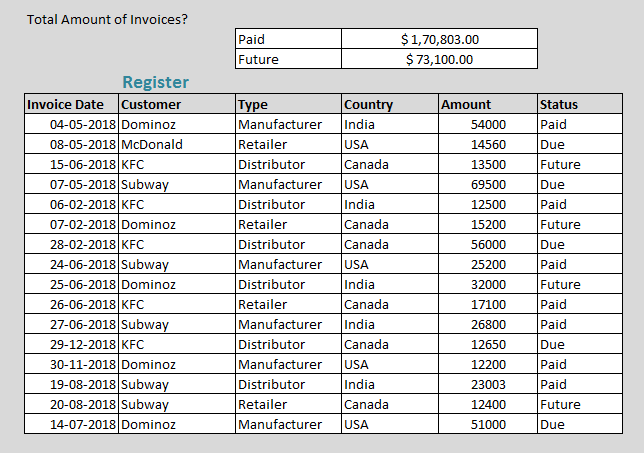
Now, I tell to you what exactly happened in the result. First of all, it retrieved data from “Status” column as Range, then select “Paid” string as Criteria and finally the sum of “Amount” column of all status where status lies with “Paid”. This is a basic data mining process, now we will discuss some other complex data.
Data Summarization with DSUM()
Let’s take an example, remember that we will use the same table in this example. So, let’s understand the summarization with multiple criteria. I want to retrieve total amount of paid for subway customers who are the distributor. Here is the table as follows.
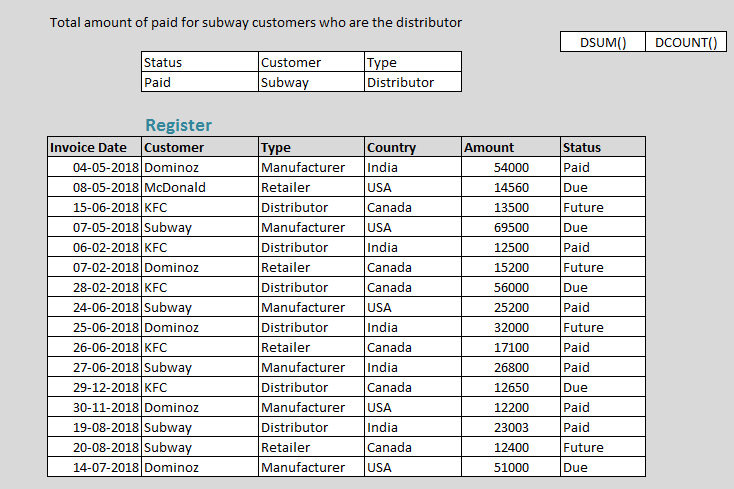
In the table, we will use the DSUM() and DCOUNT() formula to mining the data in the more complex form. Some important points you need to follow. First of all, select the table and give it an appropriate name in the box as follows.
Now, the formula like =DSUM(Database, Field, Criteria), I tell you about these arguments as follows
Arguments
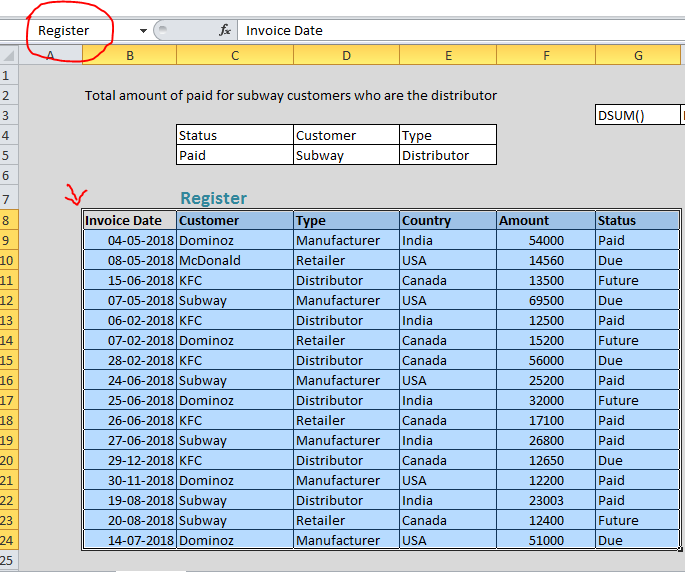
- Database: Once you create the table, then select the complete table and go to the name box field, change the name & click on the Enter key. As a result, you will have the table name as Register and one more benefit to create the database you will not need to select the table again and again just scroll the table name in the formula.
=DSUM(Database, Field, Criteria)
- Field: This field is more important than other arguments, this contains only column name. So, when you finish database write only column name as the field in the formula.
=DSUM(Database, Field, Criteria)
- Criteria: As you can see in the result, we analyzed the rows range from C4: E6. Note that you do not need to take ranger criteria from the table.
=DSUM(Database, Field, Criteria).
Finally, when you type the formula then click on the Tab key and find the result as follows.
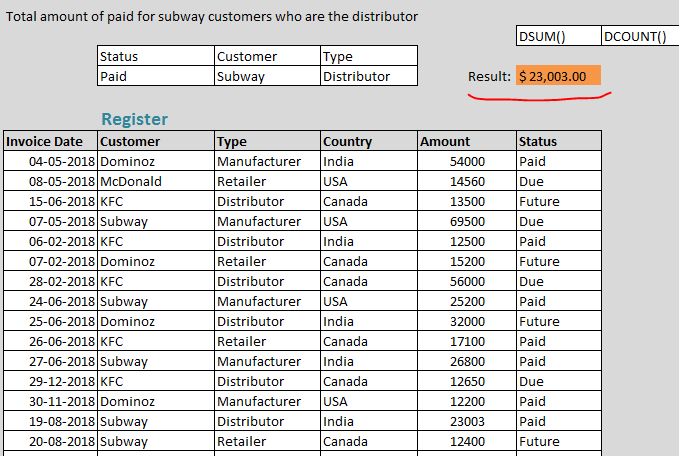
In the output, this formula summarized the whole content of the sheet, it matches the condition we provided as status as Paid, Customer as Subway and type as Distributor. We can find the same result with DCOUNT() formula. Let’s understand with an example.
Data Summarization with DCOUNT()
For now, we will use the same table ‘Register’, here Dcount() defines the same arguments but the result set would be different as follows. After this, type the formula like =DCOUNT(Database, Field, Criteria), I tell these arguments as follows
Arguments
- Database: Once you create the table, then select the complete table and go to the name box field, change the name and press Enter key. As a result, you will have the table name as Register and one more benefit to create the database you will not need to select the table again and again just scroll the table name in the formula.
=DSUM(Database, Field, Criteria)
- Field: Field can be taken as the column name as “Amount” in the table
=DSUM(Database, Field, Criteria)
- Criteria: Criteria should define separately from the table as Status as Paid, Customer as Subway, and Type as Distributor.
=DSUM(Database, Field, Criteria).
Finally, when you type the formula then press the Tab key and get the result as follows.
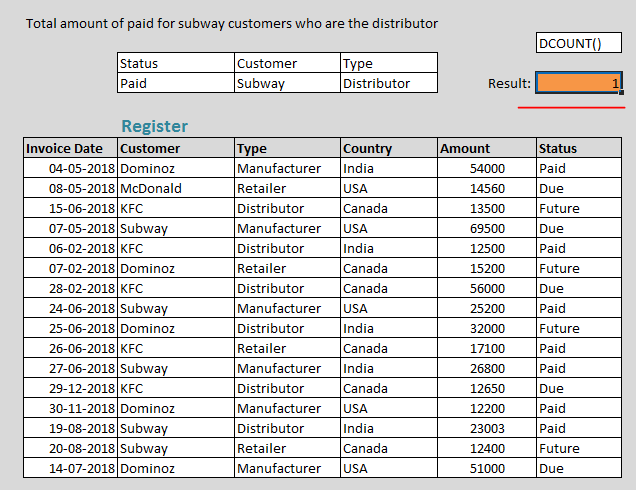
Finally, the result would count only the condition we provided in the formula.
Data Summarization with Pivot Table
The pivot table is the main key feature of the excel which summarizes the data records in a quick manner. Sometimes it gives the clear result than SQL because sometimes you can not get the same result as Excel. Pivot is the only entity which works in excel and the database. You can use pivot table only with selected rows and column in the table. It does not take the records from unselected data fields.
It really helps to find the summarize data. So, let’s understand the pivot filter in data mining. For this reason, we will use the same table as above as follows.
I need to tell you that pivot filter contains four filters as follows.
Report Filter
This filter only takes the data at the top of the pivot table. In the table, we have six columns like Invoice, Date, Customer, Type, Country, Amount, and Status. Now add a filter and drag the selected field to the filter window.
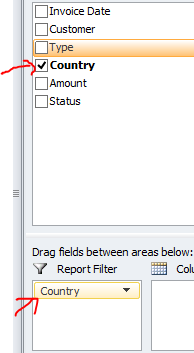
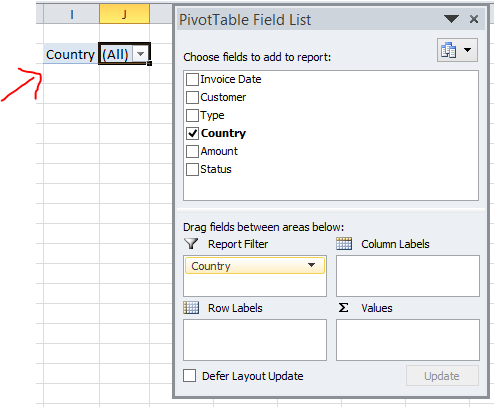
When you drag the selected country column to the report filter, then you will see Country(ALL) in the worksheet.
Note: You can choose multiple filters at a single unit of time. When you drag the filter you may find the inside field like as shown below
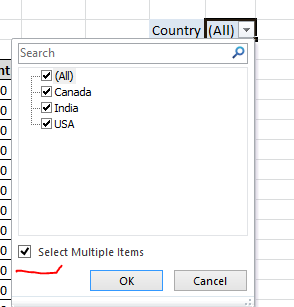
In this schema, you can choose multiple filters in the field as Select Multiple Items. If you click on the checkbox filter, then report filter will retrieve all of the data from the table. If you need to clear the checkbox, either click on ‘Select Multiple Items’ checkbox again or click on (ALL) checkbox. Also, you can change multiple colors of report filer.
Column Filter
This filter is same as report filter. Column filter shows the result in a horizontal manner. Now we take a column to filter on a ‘Country’ column as follows.
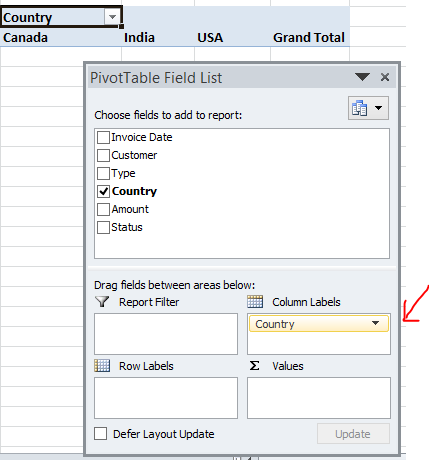
‘Country’ filter shows at the upper side in the spreadsheet. Here, you can drag-down the list of the ‘Country’ column and get the result. It shows the same result as report filter but you will not find the checkbox on the downside of the filter. You can choose one or more than one checkbox if there is no need then click on “Select All” checkbox.
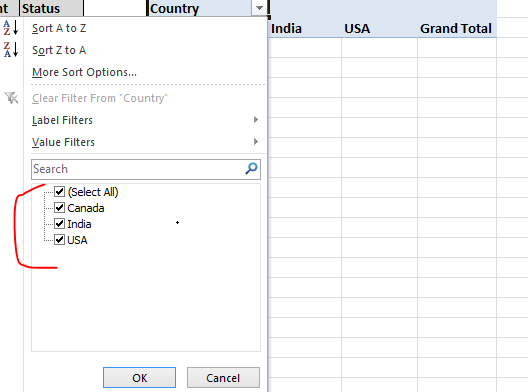
Also, you may find the search option in the column filter label at the top of the field list as follows. If a table contains data in bulk and you check the column filter but it will take too much time to find the exact result. Just type something and that string will pop up at the front then press OK button and get the selected result.
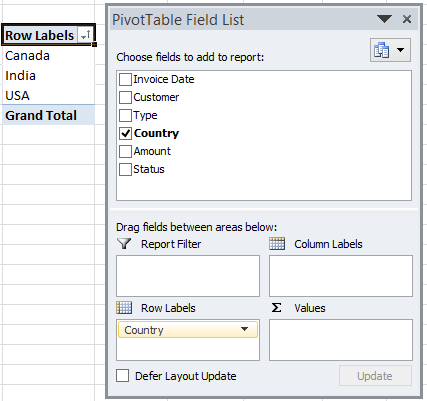
Row Filter Label
Row filter label work in a vertical zone. This filter gives the same result as report and column filter. Just drag the country column to the row label as follows.
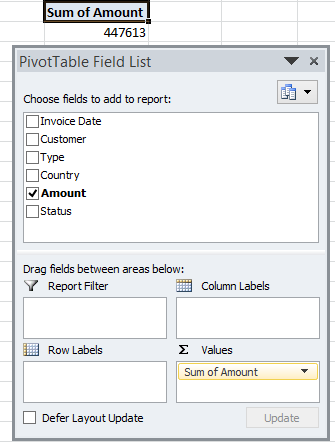
Value Field
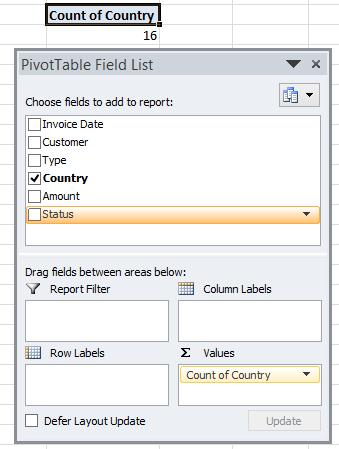
Value field gives the total sum of the number value and if you drag another column instead of amount string then it will give you count result.
First of all, drag Amount column into the values field and see the output.
If you drag a Country column to the value field then it will give you the total count of the Country column. In this situation, it will also count duplicate result as follows below.
I have covered all four segments of pivot filter. Now let’s do some actions. I want to display the complete amount of customers like Domino, Subway, and country like “USA” where status should “Paid”. Finally, you get the output as follows.
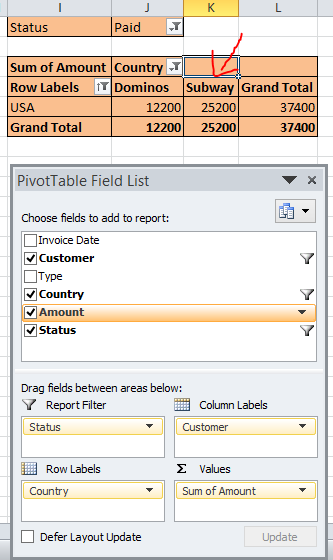
Finally, here is the output that we required. We drag and drop the Status column into the Report Filter, customer column into the Column filter, Country into the Row label and Amount into the values filter. The major point of a pivot you can put any column in Row label or in Column Label but the structure would be different. You can do it as per your choice. Now, I want to display all Country with status type Future and Due. Finally, you get the output as follows.
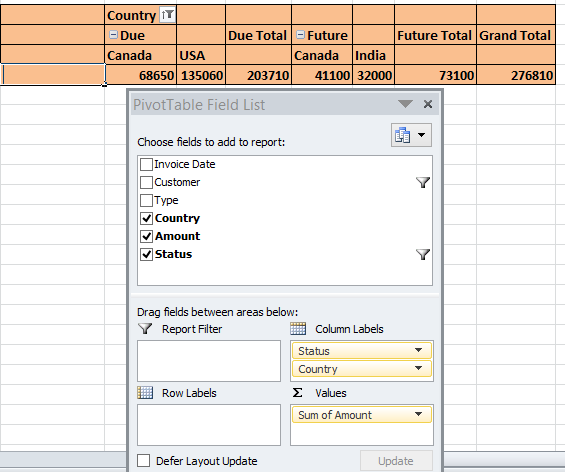
Here, I tried to drag the columns into different fields but the result set is same. These are some main power filters for data summarization in data mining.
Conclusion
I hope you enjoyed the data summarization and its amazing techniques in data mining. There are many more examples from where you summarize the data in a quick manner. I suggest you to use pivot filter for mining the data. It solves millions of the data in a quick manner. Although, excel formula is sensitive so make your move wisely in the table. Nowadays, the corporate companies work on big data so most of them make use of excel formula for data summarization in data mining.
Thank you!
- LinkedIn Scraper | LinkedIn Data Extractor Software Tool - February 22, 2021
- Is Web Scraping Legal? - February 15, 2021
- What Is Data Scraping? - February 10, 2021
thank you.