“Visualization is really about external cognition; that is, how resources outside the mind can be used to boost the cognitive capabilities of the mind.” — Stuart Card
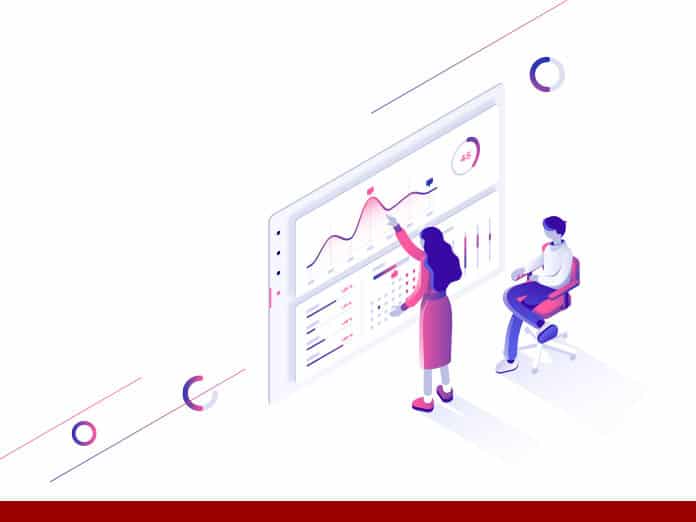
Data visualization is the presentation of data in a graphical/pictorial format. This blog focuses on the importance of data visualization. The amount and complexity of knowledge generated at staggering levels in research, engineering, industry, and daily human activity are growing. Effective visualizations not only provide a visual representation of data but also enhance comprehension, communication, and decision-making.
Modern technology has been instrumental in allowing the use of data analysis to support businesses. The primary aim of data visualization is to simply and efficiently convey information through statistical graphs, plots, and information graphs.
Data visualization will be beneficial for your company to analyze the data and make the right decision according to the market climate. It will simplify the business insight process and also help you find new business opportunities by accessing, evaluating big data, and interpreting the data.

Jump to Section
Advantages of Visualization
-
Understanding business insights:
By using data analysis software, company organizations will increase their revenues and gain more revenue. Many businesses have been using applications and dashboards for data visualization to understand their business insights to improve their productivity and performance.
-
Business activities and operations:
In a competitive business environment, finding the correlations between operating conditions and performance of the business is significant. Visualization of data will help you understand those correlations. In keeping their product marketing and customer satisfaction in mind, it will allow the senior management to make better decisions.
-
Acting on emerging trends faster:
The amount of data businesses can collect about consumers, and market trends will provide insights into potential sales and growth opportunities for business leaders. By using data visualization, decision-makers will be able to grasp changes in customer behavior and market conditions much more efficiently across multiple data sets.
-
Customer satisfaction:
For any company, managing customers is the greatest challenge. When you have the details, you can handle the customers effectively. You can link and touch them via different mediums like digital media. The data visualization program will help you retain customers because it will identify the actions of your customers according to their geographic position and interest. The analytics will help you understand your business and where your company has received a lot of responses. You should concentrate on the consumers and the market.
-
Sales:
You can also boost revenue by using the data visualization program. The analytics will help you understand the competition and better develop your strategy. An in-depth sales analysis will help you forecast your company’s sales.
The need for visualization
Business intelligence and data analytics software developers are increasingly using sophisticated data analysis technologies. To manage large amounts of data that help knowledge workers understand analytical results better.
Companies are being bombarded with data today; And so there is a need to turn it into smart business decisions. Although most of the conventional business intelligence tools are targeted towards just market analysts or a few decision-makers, data visualization is seen as a way to make business analytics accessible to a broader audience.
Interactive tools such as Dygraphs, ZingChart, FusionCharts, and many others through Data Visualization offer a deeper understanding of the relationships and patterns in data sets. Companies initially created such techniques as ad hoc methods for solving a specific problem within a given collection of data and have gained enormous popularity.
What about Visualization tools?
The size of your company doesn’t matter; to understand your business, you can start using the data visualization tools and the application. Today, there are many resources available, so make sure you use the right tools to help you understand and analyze your market insights. Like, Plotly, Tableau, Microsoft Power BI are some of the best resources available on the Web.
When using data visualization for your business, keep in mind that data reliability is critical. Graphs don’t tell the whole story because it’s solely dependent on the input data, make sure you have the correct data. Your description also matters to your company so that your company is established according to the market climate that you have. Data visualization software will help you make better business decisions, but you need the right customer and business data.
Our world expands with new ways of looking at the data. When the demand for modern sensibility and color increases, we need to continue to create well-designed visuals, which will have a considerable effect. When you encounter a captivating object and can see it clearly in a moment, the brain feels it’s interesting; well-structured knowledge is perfect for the human mind. Hundreds of businesses use it to their benefit. Will you? Explore Loginworks Softwares for Data Analytics Consulting Services; please share your feedback and opinion on the article in the comment section below.
I excel when it comes to making bespoke data dashboards and visualizations that users and clients absolutely love. Sharing about things I enjoy doing is my hobby, whether it's about a project, collaboration, feedback, or just simple how-to guides about visualization.
If you have something to ask or share, I'd love to hear from you!
- Business Intelligence Vs Data Analytics: What’s the Difference? - December 10, 2020
- Effective Ways Data Analytics Helps Improve Business Growth - July 28, 2020
- How the Automotive Industry is Benefitting From Web Scraping - July 23, 2020