What Is Big Data Visualization?
Introduction to Data Visualization With the recent advancements in big data, it …
Introduction to Data Visualization With the recent advancements in big data, it …
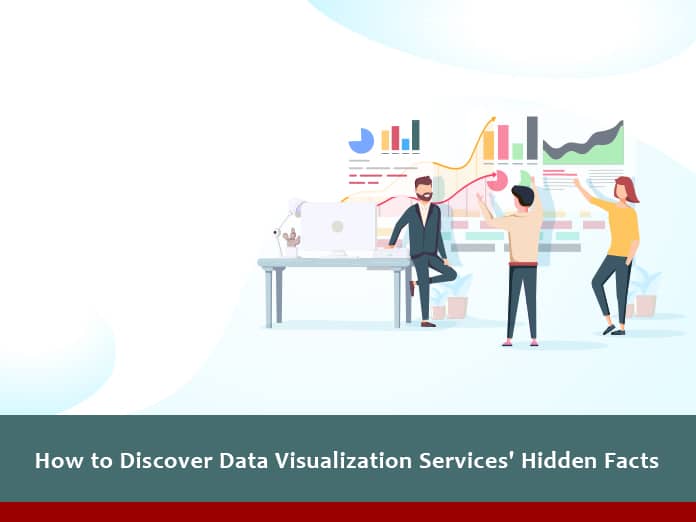
Data reporting is essential for us to show off the awesome things …

Google Data Studio allows you to create data visualization reports that can …
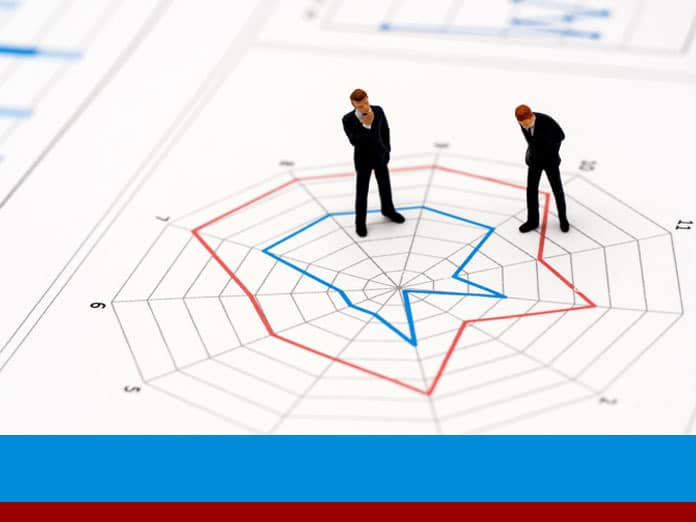
Radar charts, also known as spider charts, are described by datavizcatalogue.com as …

A data analyst should always keep in mind an important fact that …

If you’re familiar with data analysis, then you must be aware of …

“Visualization is really about external cognition; that is, how resources outside the …
Hi everyone, Hope you are doing well, welcome back to Loginworks’ blog. …

In this blog, we will continue looking at more DAX “bear necessities” …
Google Data Studio gives you all that you have to transform your …