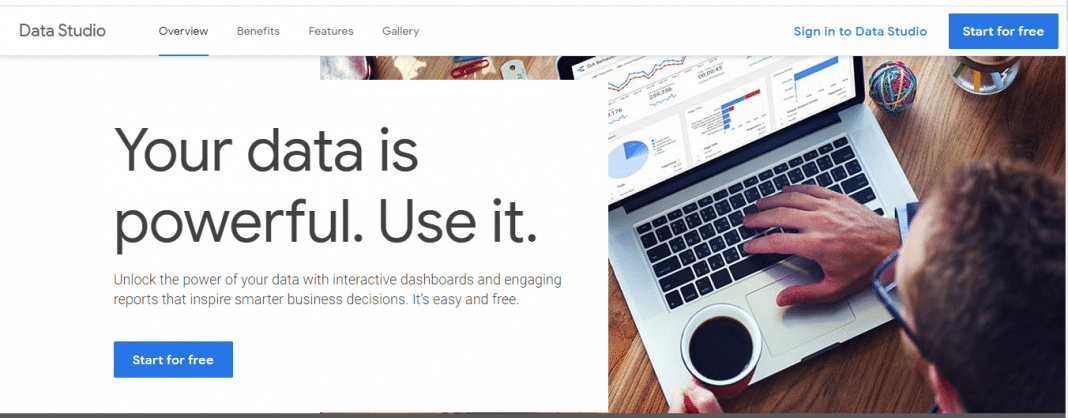
Google Data Studio allows you to create data visualization reports that can be shared with your clients. In this blog post, we will explain the advantages of Google Data Studio for visualization and how to try it out.
Data analysis has always been a challenge for most digital marketers. This can be frustrating, daunting, and, quite honestly, impossible for average human beings to understand and interpret. In many cases, marketers don’t even report back analytics to their clients because they’re not sure where to start because of the sheer volume of information and difficult-to-understand data.
Jump to Section
Data Is Omnipresent
As we all know, data is omnipresent in many forms. It is there in financial data, retail data, among others.
There was no easy way to understand the Data only by looking at it because thousands of rows are present. Therefore, if you’re like most of the agencies that provide analytics reports to clients, it usually means laboriously downloading data from Google Analytics and putting that data into Excel spreadsheets to create charts and diagrams.
Google now helps you to create reports that even your clients can understand—through Google Data Studio.
What Is Google Data Studio?

It is a data visualization tool that can transform your data into informative, easily understandable reports.
You can easily exchange these reports with other customers, or you can set specific data access rules. For example, if you want to grant the client read-only access, you can easily accomplish that, or you can download the full report in a PDF format.
Google Data Studio offers numerous forms of data visualizations to represent data graphically. These visualizations include a bar chart, line chart, combination chart, pie chart, or tabular format. You can easily adjust the visualization type, such as font size, background color, and even place your company’s image logo.
Benefits of Google Data Studio
Data Studio combines data from a range of reporting and analysis sources. It can also distribute dashboards to the organization as you do Google Drive files, report/page/chart level filter data, brand dashboards, and more.
Using Data Studio for the First Time
Initially, shifting toward a more visual, interactive layout of your company and marketing data can be hard. It is particularly the case if you come to monitor and evaluate using data aggregators or in-platform monitor builders (e.g., Google AdWords, Google Analytics) for reporting.
You might be tempted to simply import the dashboard you already use through Data Studio and report on the data the same way in Data Studio.
What Are the Advantages of Using Google Data Studio?
Google Data Studio comes with many benefits that we are going to explain below.
Widget Options
- You can add unlimited widgets: As compared to Google Analytics, which only allows up to 12 graphs or charts in a study, Google Data Studio allows you to have any number of widgets in it. This interface helps you to share and describe your data in many ways.
- Widget options include Heat graphs by area, state, or country, Pie charts, Time series graphs, and much more. You can also customize each of these widgets with a variety of metrics. Therefore, Google Data Studio gives you tremendous flexibility in how you build your reports and distribute your data. That is why Data Studio is an important resource for businesses.
Customized Reports
- Easy to read reports: Data Studio reports can be subdivided into 1 page or 20 pages, showing the Google Data Studio’s versatility and customization. This adapts to the particular needs of the company, making it a stress-free environment for vital data sharing.
- The layout of your report can be customized. Thus, changing fonts, colors, patterns, and sizes makes any report easy to read. Plus, you can add 1 to 10 widgets per screen anywhere. This layout helps you to provide a view of your campaign from every angle to team leaders and company decision-makers. Reward yourself with these easy-to-understand reports and your company too.
- Dynamic reporting: Data editing can be done in real-time manually by your team. You can also allow Google Data Studio to pull the data into your reports in real-time. You can also set up your notifications to automatically update and fill your widgets with in-the-moment info. If you want any widgets to show current details, you can. But, if you like, you can also keep those data set to last month. Therefore, this comprehensive reporting lets you have infinite data options to support your company better.
Ease of Sharing
- Easy Sharing: When you compile or analyze Data Studio reports with so many data choices and measurements, you can quickly get the feedback of your team members, dedicated account managers, or company decision-makers—without any extra hassle.
Free Templates and Free Usage
- Free templates: Not a Google Analytics pro? No worries about that! Google Data Studio has already developed models that can help with your files. The app comes preloaded with templates for Google Analytics, Google Advertising, YouTube, and many more. It also comes with models for a specific sector, such as e-commerce.
- Free of cost: That’s Right. Google Data Studio is free to download. Google’s doing a great job of creating an array of intuitive resources that save time. When Data Studio was first released, users were given a 5-report limit. The cap has been removed for a long time now. Currently, without any restrictions, anyone can make use of these professional dashboards. And it’s completely free of cost.
How to Use Google Data Studio?
If you are ready to use Google Data Studio, follow these steps:
- Just log in to Google Data Studio with your Google account.
- Click on the “Create” button in the top left corner.
- Select “Data Source.”
- Link your data sources, like Google Analytics.
- Return to the Google Data Studio dashboard.
- Select the “Create” button in the top left corner.
- Choose “Report.”
- Pick your data sources to import from the right-hand side.
- Edit your report’s layout, theme, colors, among other customizations.
- Click “Share” in the upper right corner to share your report.

Is Google Data Studio the Best Tool for You?
If you’re the sort of person who likes to work with spreadsheets, you may not think Data Studio is a big deal. However, for people who hate spreadsheets, this is a miracle. (Finally, you can take a look at your analytical data — and it makes sense.)
With Data Studio, when you speak to your local clients, you can easily show them the results of your efforts in an easy-to-understand, universally recognizable report!
Let us know if there are any particular aspects of data visualization or Power BI that would be of interest to you for consulting or project needs.
Please share your thoughts and suggestions in the comments section below. Feel free to share our blog on your social media. Happy learning!
What do you think about that, then? Come and start your journey with Loginworks Softwares.
- What Is Big Data Visualization? - January 22, 2021
- Five Benefits of Big Data Analytics for E-commerce - July 9, 2020
- Google Data Studio Vs. Tableau: Which One is More Suitable for Your Business? - June 25, 2020

