Data reporting is essential for us to show off the awesome things that we do every day! But if your data isn’t presented to the client in an organized, appealing way, your results may be lost. Here comes data visualization to the rescue. Google Data Studio Vs. Tableau – which one is the better data visualization tool for your business?
Data visualization is a vital skill in today’s digital marketing and analytics industry to understand and convey data insights. We all know the advantages of interactive data visualization, including:
- Ease of use
- Simplification of communication between the company’s departments
- The opportunity to compact vast amounts of data into simple, easy-to-read visuals
Jump to Section
Data Visualization Tools
Google Data Studio (GDS) and Tableau are two tools that are widely used to make data analysis customer-friendly and straightforward. GDS is a free Google tool, and it allows users to create customized reports of data from Google products and external sources. The tool has become more popular with marketers, particularly those who use Google Suite products regularly. Tableau is a data analysis and visualization tool that Salesforce has recently acquired. Tableau has served thousands of companies, establishing itself as a market-leading business intelligence tool.
Still trying to figure out which software is right for you! With this post, we would clear all your doubts and provide you with an unbiased list of the advantages and limitations of each data visualization tool.
Easy Onboarding
Okay, let’s be frank–among the features of interactive data visualization tools that exist, between their cost and functionality differences a lot of times, all we care about is how easy it would be to use.
Even if you don’t have any experience in data analysis, GDS would be much easier to get started. It is a great data analytics tool for general data visualization needs and does not include complex graphics and capabilities.
Integration
Below we compare the integration capabilities of Google Data Studio and Tableau.
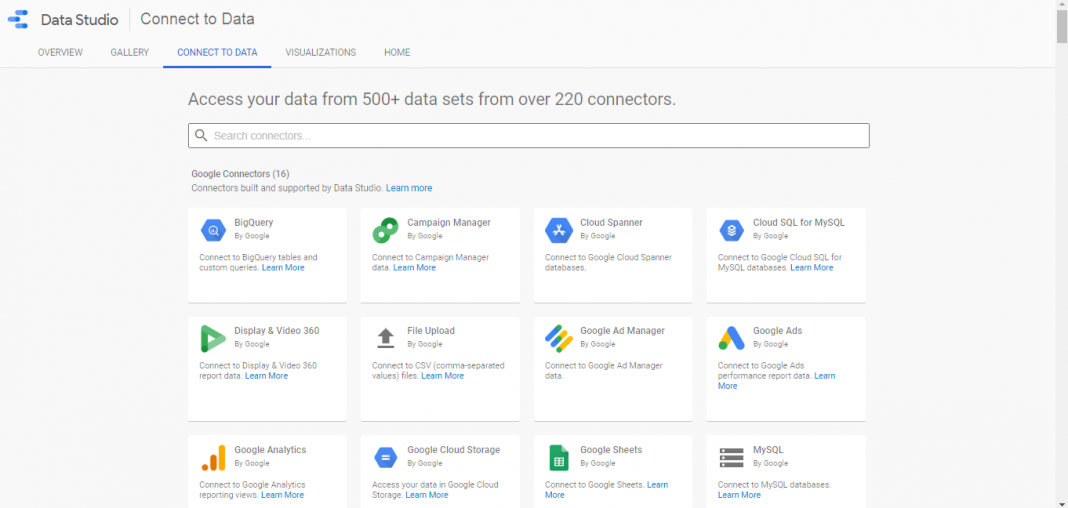
Google Data Studio
If you are already using the Google Analytics suite and its products to fulfill your business requirements, combining them with the GDS would be a smooth experience. Google AdWords, Google Analytics, and even Google Sheets are natively fully integrated with GDS. Therefore, subtracting and importing data from these sources to GDS data visualization tools would be very easy.
There will also be no problems connecting GDS to data sources outside the Google suite. Here’s a complete list of any app to which you can link to. The full list of GDS native integrators is currently over 200 and still counting!
Tableau
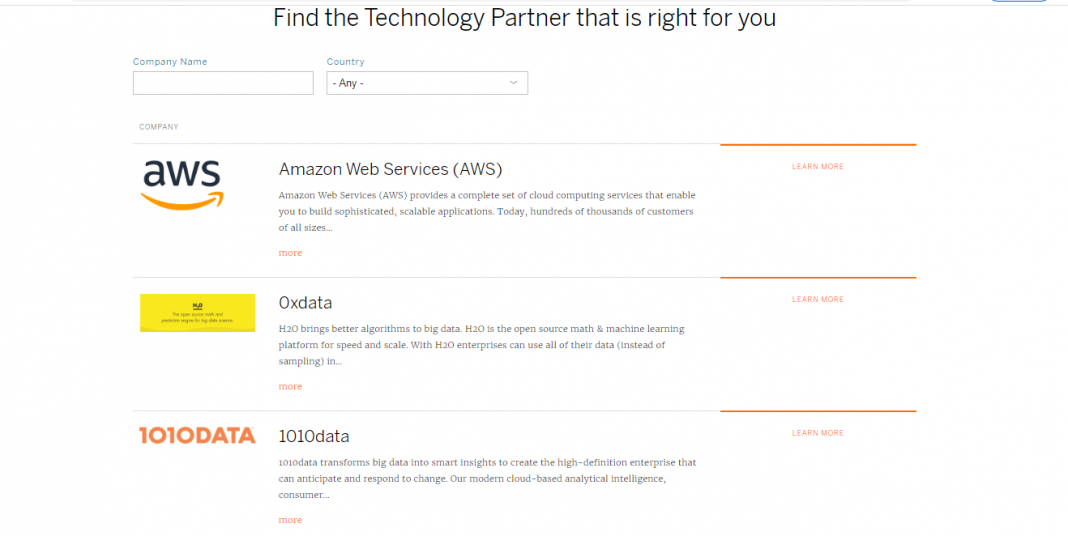
Tableau also includes a large number of data source connectors. These can be directly integrated into your Tableau data visualization software. You can search for specific connectors that you already have or search through the Tableau Supported Connectors list.
And even more, interestingly, Tableau data visualization software has just launched a new feature called Tableau ServiceNow. It allows you to “dive directly into your source systems and take a closer look at how they perform.” Tableau emphasizes that it will enable you to synchronize and analyze your data instantly.
Prices
Below is the price comparison between Google Data Studio and Tableau.
Google Data Studio
Pricing is a big difference in the quality of the GDS versus Tableau competition. But, just how different is the pricing?
The truth is, it’s really different. GDS is free of charge, while Tableau is quite expensive, ranging from approximately $70 per user a month.
GDS allows you to execute a wide range of interactive data visualization operations without having to spend any money. All you need to do is create a Google Account if you haven’t already imported your data. And with this, you’re ready to visualize your data without any hassles!
Tableau
In contrast, Tableau is the complete opposite. There’s no free version, but there’s a 14-day free trial so that you can try out the features of their data visualization. The price for Tableau packages depends on the number of people on your team and the elements of data visualization you want them to use. As an individual, you can buy an annual plan for a simple $70 a month. But as an organization, you will need to invest quite more than that.
The final number on your Tableau data visualization bill will vary depending on the number of roles you are purchasing, and wherever you plan to host data on or on your Tableau servers.
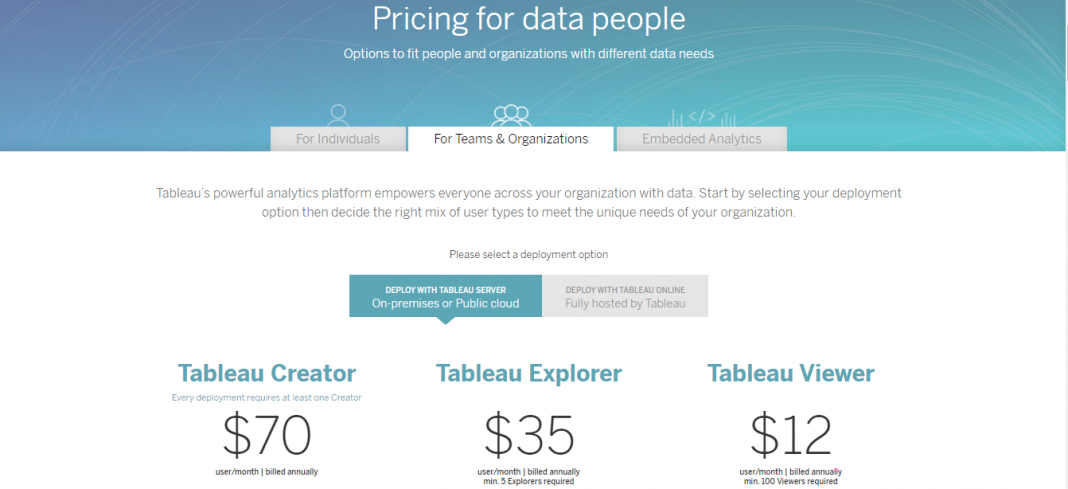
With three different Creator, Explorer, and Viewer price packages, you can assign different roles of data visualization and access levels depending on the contribution of employees to the data visualization process.
But beware, you can’t just choose a random number of Tableau explorers, viewers and creators and place them in a price bundle. You will need to purchase at least 1 creator, 5 explorers, and at least 100 viewers to proceed with the enterprise package.
Functionality
Below is a comparison between the functionalities of Google Data Studio and Tableau.
Google Data Studio
GDS is an entirely free software for the visualization of data, as discussed above. That means that the capabilities of GDS are less complicated than those of the paid Tableau packages described above.
Nevertheless, GDS is the obvious choice if you are looking for a great, yet simple data visualization tool that will help you shape your multilevel data into one beautiful interactive dashboard. With GDS, you can easily build a line, pie, and bar charts, followed by multiple filtering options. At the same time, in GDS dashboards, you can use advanced techniques such as using machine learning, programming languages, or custom multigrade formulas.
Tableau
If you love to play around with data and dive deep into data, Tableau is a data visualization tool just for you. The dashboard of Tableau is undoubtedly not the most user-friendly one, and it will often be challenging to get around if you don’t already have a degree in data analytics. Still, if you need complicated data reports and analysis, it’s worth it.
Tableau helps you to use a range of sophisticated strategies for data processing, such as:
- Machine learning,
- Big data,
- Smart analytics,
- Survey analysis,
- Predictive analytics, and more.
Tableau is also more abundant in terms of design flexibility. Still, the Tableau data visualization toolkit lacks some simple functions such as drawing arrows.
Conclusion
As discussed in the sections above, Tableau and GDS are quite different in many ways of visualizing data.
To make your decision-making process easier, here’s the rule of thumb follow:
If you’re a large business focusing on data subtraction and use with a team of on-site data analysts, then go for Tableau. It will open up a new horizon that includes not only data visualization but also data analytics capabilities specific to your business.
If you’re a small to medium-sized business that appreciates data visualization but isn’t ready to invest its time and money in first-class data reporting, go for GDS. GDS data visualization software will allow you to create beautiful dashboards for your investors and potential clients quickly without asking for any commitment to money or human resources.
Still struggling to make a decision?
Please feel free to contact the Loginworks team if you need help setting up your GDS or Tableau dashboard, managing data analytics reports, or deciding on the best-suited platform for you!
- What Is Big Data Visualization? - January 22, 2021
- Five Benefits of Big Data Analytics for E-commerce - July 9, 2020
- Google Data Studio Vs. Tableau: Which One is More Suitable for Your Business? - June 25, 2020
Some really interesting details you have written.Assisted me a lot,
just what I was searching for :D.