Jump to Section
Introduction
Tableau is one of the leading Business Intelligence tools. Data Science and Business Intelligence professionals mainly use it. Data visualization is the graphic representation of the data and facts. Tableau can be used to form powerful data visualizations. It can also be used to extract insights for quality decision-making. 
Tableau is powerful and the best tool to transform or change raw data into a simple perceivable format. Tableau can analyze data very quickly. The dashboards and worksheets generated give actionable insights and drive the business forward.
Tableau is perfectly smart for business intelligence professionals, given its extensive list of offerings from data exploration to powerful data explanation. The drag-and-drop interface permits you to grasp information visually, and this enables anyone to perform and share self-services data analytics with colleagues in seconds.
The visualizations created with Tableau are in the form of dashboards and worksheets. The data generated by Tableau is understandable by professionals in an organization. It even permits a non-technical user to create a customized dashboard.
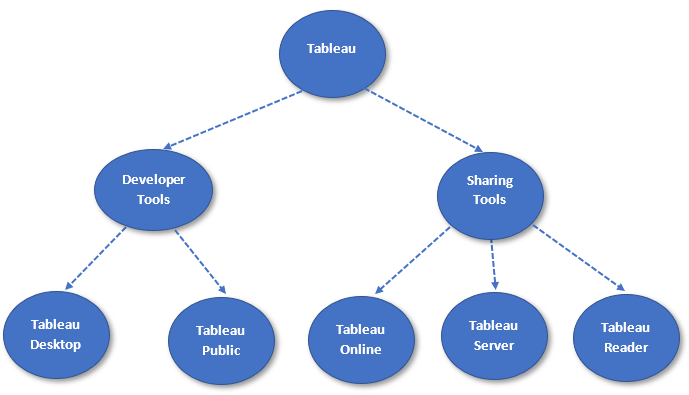
Tableau Consists Of
- Developer Tools
- Tableau Desktop
- Tableau Public
- Sharing Tools
- Tableau – Online
- Server
- Reader
Developer Tools
The developer tools are specially used for development. They are generally used for the creation of dashboards and charts. They are also used for visualization and report generation. Therefore, it comes under this category. The tools include Tableau Desktop and Tableau Public.
Tableau Desktop
Tableau Desktop has a rich feature set and allows us to create reports. If you create charts and reports, you can blend them all to form a dashboard. Unlimited rows of data can be stored, processed, and shared in Tableau Desktop.
Firstly, for live data analysis – Tableau Desktop can also provide connectivity to Data Warehouse. It also provides connectivity to other various types of files. Secondly, the workbooks and the dashboards created on Tableau Desktop can be either shared locally or publicly.
The target demographics of Tableau Desktop are Data Scientists, Business Intelligence Developers, and Business Intelligence Professionals.
Tableau Public
The Tableau Public is specially built for cost-effective users. Similarly, in the same way – the workbooks created here cannot be saved locally. But the reports should be saved to Tableau’s public cloud, which can be viewed and accessed by anyone.
It doesn’t provide privacy to the files saved to the cloud since anyone can download and access the files. This version is the best for the individuals who want to learn Tableau and for the ones who want to share their data publically. Approximately 1 million data can be stored, processed, and shared in Tableau Public.
The target demographics of Tableau Public are beginners in the field of Data Analysis and Business Intelligence Enthusiasts.
Sharing Tools
The sharing tool is used to share the reports, dashboards using this developer tools. The sharing tools are Online, Server, and Reader.
Tableau Online
Firstly, it is an online sharing tool. Secondly, it is similar to the tableau server. But the data is stored on servers hosted in the cloud, which are maintained by the Tableau group.
On the other hand, the data published here have no storage limit. But it creates a direct link to over 40 data sources that are hosted in the cloud, such as Hive, Spark SQL, MySQL, etc.
Next, in the meantime, to publish on both the Server and Tableau online, you need to create the workbooks on Tableau Desktop. Salesforce.com and Google Analytics data can also use by them.
Tableau Server
The workbooks, reports, dashboards that are complete on Tableau Desktop can be accessible across the organization using Tableau server. To share your work in this Server, you need to upload your work from Tableau Desktop to this Server. Lastly, it will be accessible to the whole organization once the work is complete and uploaded. The data uploaded o the Server is only accessible to the licensed users.
To access the dashboards from this Server, the users do not need to have it installed on their machine. They require log-in credentials and access the reports via a web browser. This Server provides high-security. Organizations use it for quick and effective data sharing.
Tableau Reader
It is a free tool that allows you to view the dashboards and reports created using Tableau Desktop or Tableau Public. Modification and editing are restricting for data filtering. The security level is zero in this as anyone who gets the workbook can view it using this Reader. In this Reader, there is no limit to the rows of data that can be read.
The target demographics of Tableau Desktop are CEO, CFO, CTO, Directors, Managers, etc. who only need to read data.
Security in Tableau
Firstly, Security is the most important and critical part of the data. Secondly, Tableau provides comprehensive features, and along with deep integration to address all aspects of enterprise security. Subsequently, It provides namely the following types of securities:
- Authentication: Authentication verifies a user’s identity. Everyone who needs to access the Server whether to manage the Server and to publish content must be represented as a user in its repository.
- Authorization: Authorization refers to how and what users can access on its Server after authentication has been verified.
- Data security: Tableau provides several ways for you to control which users can see which data.
- Network Security: There are three main network interfaces in this as below:
- Client to Tableau Server: A client in the tableau server can be a Tableau Mobile, Tableau Desktop, a web browser. Clients use standard HTTP requests and responses for communications.
- Tableau Server to your Database: Tableau server builds a dynamic connection to your database to process & refresh. The Tableau server stores the data in encrypted form for their internal database. As well, use this Server for better understanding.
Conclusion
Above, we have focused on Tableau Introduction, Tableau Data visualization, Tableau Data Analytics, Tableau Security features. With those points, we have noticed that Tableau is the most powerful fastest growing Data visualization and analytical tool used in the Business Intelligence industry, which provides high-level Security. We noticed that anyone with a non-technical background could use Tableau for visualization. Tableau desktop has rich features set that allow you to code and customize reports. Tableau connects and extracts data stored in various places. It can pull data from any platform very easily.
Please feel free to leave any feedback or suggestions in the comment section below.
I excel when it comes to making bespoke data dashboards and visualizations that users and clients absolutely love. Sharing about things I enjoy doing is my hobby, whether it's about a project, collaboration, feedback, or just simple how-to guides about visualization.
If you have something to ask or share, I'd love to hear from you!
- Business Intelligence Vs Data Analytics: What’s the Difference? - December 10, 2020
- Effective Ways Data Analytics Helps Improve Business Growth - July 28, 2020
- How the Automotive Industry is Benefitting From Web Scraping - July 23, 2020