


In today’s blog, we will discuss the Tableau Server Repository Performance. In brief, Tableau is a widely used data visualization tool that is used in Data and Business Intelligence industry.
It helps in data formatting and data cleaning to get the best insights from data in the form of dashboards and worksheets. Tableau also provides multiple tools that allow us to drill down data and shows an effective impact of visual format that can be easily understood.
It also provides real-time data analytics and cloud support. Here we will discuss tableau server performance.
Tableau Server Repository is a database that stores metadata of tableau server user, group sessions, and projects. PostgreSQL database is known by the repository. After enabling the Tableau Server Repository. Tableau server consists of various nodes that are used to access the Tableau Server Process. Making any changes in the nodes will stop Tableau Server if it is running. As changes are applied, the Server returned to the state it was before process configuration, so if it is running, it will be restarted.
While analyzing the server performance, we will get to know the peak utilization of the central processing unit (CPU) and memory as well as sessions and Load Time.
Steps to Connect Tableau with Tableau Server Repository to Analyse CPU and Memory Utilisation
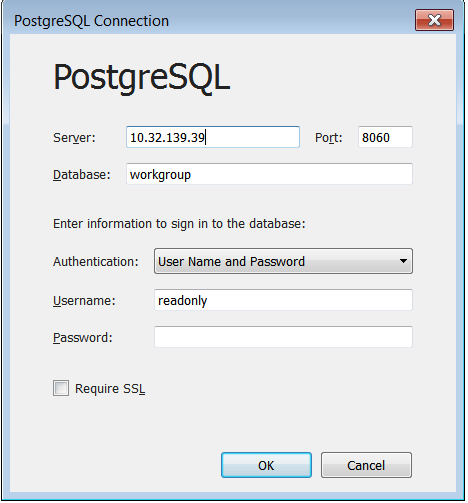
1. Connect Tableau with PostgreSQL
PostgreSQL: Also known as Postgres, it is a free and open-source relational database management system. It is a simple and easy design to handle a range of workloads from a single system to a data warehouse or Web services with many concurrent users.
2. Enter server credentials
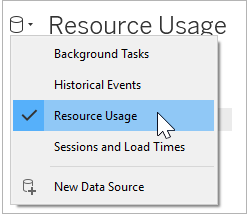
3. Click Data source tab > Resource Usage > Edit Connection
4. Use Extract option and consequently, connect to the data source
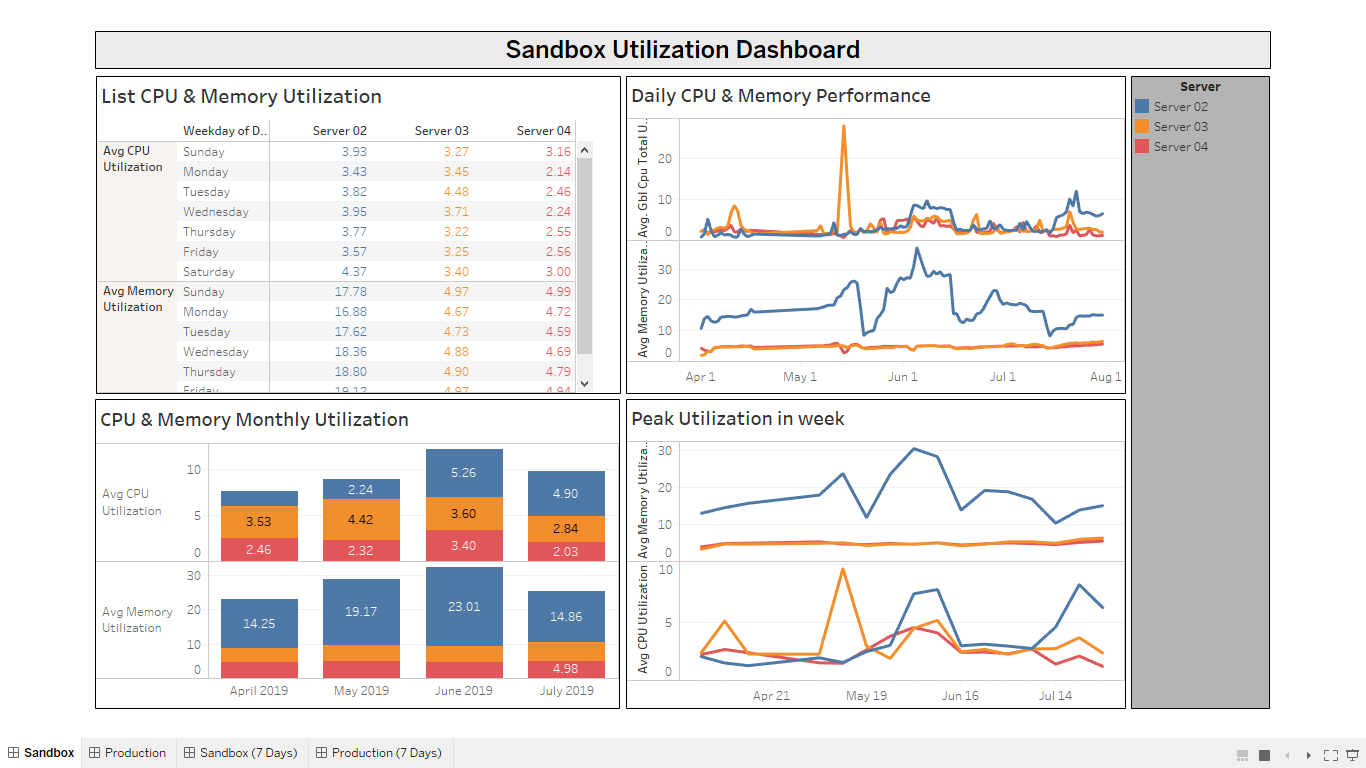
The dashboard consists of multiple servers with their average utilization of CPU and memory, daily CPU and memory performance, CPU and Memory Monthly utilization, and peak utilization in a week.
Dashboard Description
- List of CPU and Memory Utilization
- Daily CPU and Memory performance
- CPU and Memory monthly Utilization
- Peak Utilization in week
Steps to connect Tableau with Tableau server repository to analyze load time, session, and projects:
- Connect Tableau with PostgreSQL
- Enter server credentials
- Click Data source tab > Session & Load Times > Edit Connection
- Use the Extract option and connect to the data source

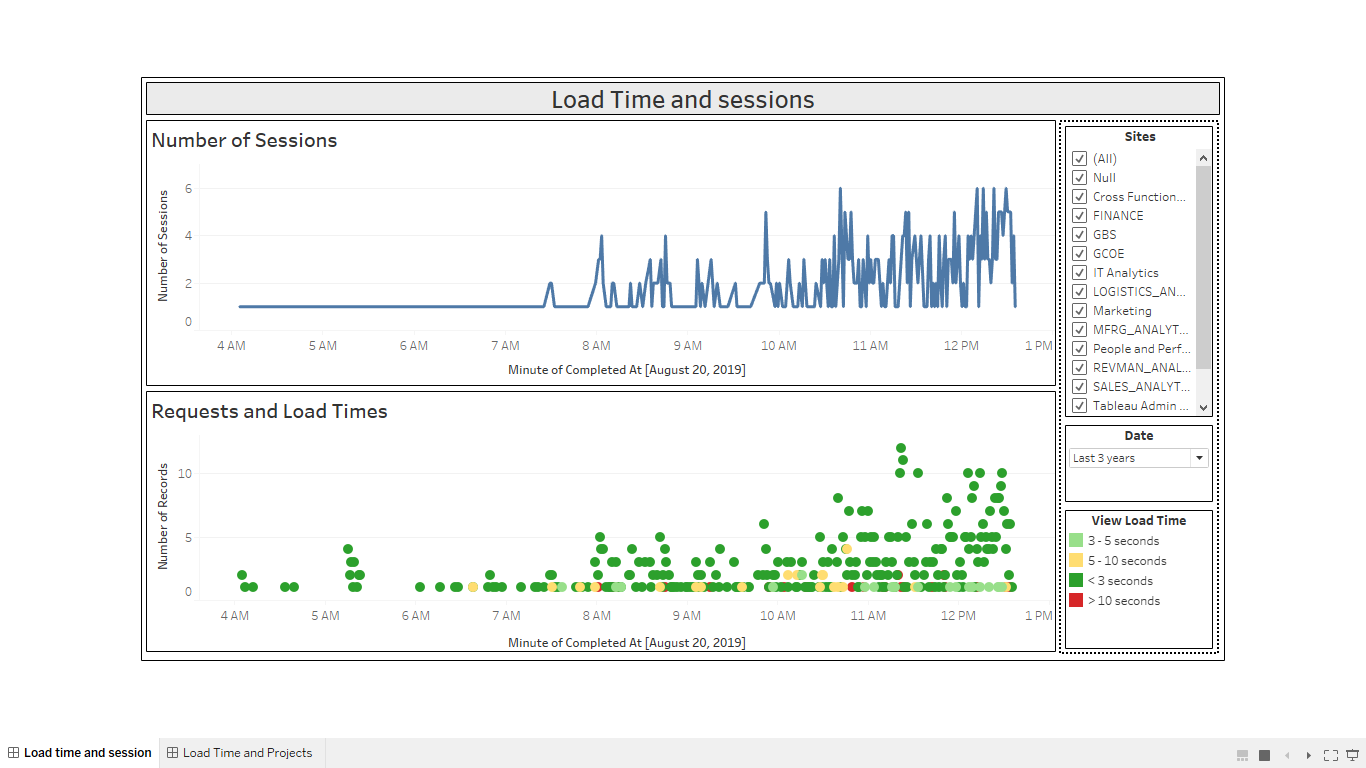
The dashboard consists of multiple servers to analyze load time and sessions.
- Number of Sessions: It shows the number of sessions raised per hour.
- Requests and Load Times: It shows Load time per hour for multiple sites.

The dashboard consists of multiple servers to analyze average load time and projects.
- Average Load time: It shows average load time taken by sites per hour
- Number of Projects: It shows a number of projects raised per hour for multiple sites and a particular date range.
Conclusion
While creating this dashboard, we have understood the utilization of CPU and Memory, load time of sessions, and projects.
To know more about our services you can visit our site for consultancy. Kindly visit Loginworks Softwares Inc.
Thank you for the read. We hope that you have enjoyed the blog. If you like it, please share it with your friends or sharing it on Twitter or Facebook. We will be happy to hear your feedback. If you have some questions, feel free to ask them in the comments section below.