The blog explains how to perform conditional formatting in power bi. By using the power bi method, we will cover all the steps that allow you to perform conditional formatting.
Different requirements come from the client, and one of the common requirements is to do conditional formatting in reports.
The topics which we will discuss in this blog include:
- A brief introduction to Power BI
- Features of Power BI
- About conditional formatting
- Types of conditional formatting

Jump to Section
What Is Power BI?
Power BI is a Business Analytics tool service by Microsoft. It expects to give intelligent representations and business insight capabilities with an interface basic enough for end clients to make their reports and dashboards.
Features of Power BI
Below are some important features of Power BI
- Integrate flawlessly with existing applications: Power BI coordinates effectively with your current business condition enabling you to adopt analytics and reporting capabilities.
- Publish reports securely: The tool helps you to set up automatic data, refresh, and publish reports, thereby allowing all the users to avail of the recent information.
- Extract business intelligence quickly and precisely: It helps in changing your business information into rich visuals, in this manner extracting business intelligence for better decision making.
- Carry advanced-data services: Microsoft Power BI tool can be integrated with advanced cloud services like Cortana or Bot framework. Along these, giving outcomes to the verbal data query given using natural language.
About Conditional Formatting
Use Conditional Formatting in Tables
With conditional formatting for tables in Power BI Desktop, you can specify modified cell colors, including shading slopes, based on the field values. You can likewise specify cell values with data bars or KPI icons or as active web links. You can apply conditional formatting to any content or data field, as long as you base the formatting on a field that has a numeric, shading name or hex code, or web URL values.
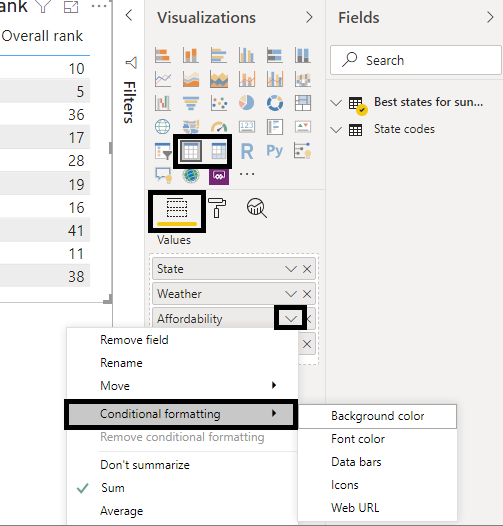
To apply conditional formatting, select a Table or Matrix visualization in Power BI Desktop. In the fields area of the Visualizations pane, right-click or choose the down-arrow alongside the field in the Values well that you need to design. Select Conditional Formatting, and afterward select the kind of formatting to apply.
Types of Conditional Formatting
There are different types of conditional formatting in Power BI, which are explained below.
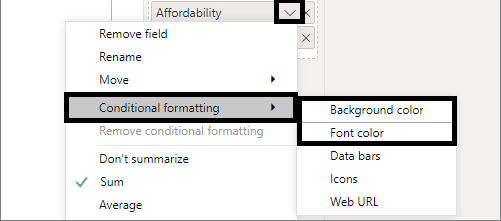
Format Font or Background Color
To format cell background or font style shading, select Conditional formatting for a field, and afterward select either Background shading or Font shading starting from the drop-down menu.
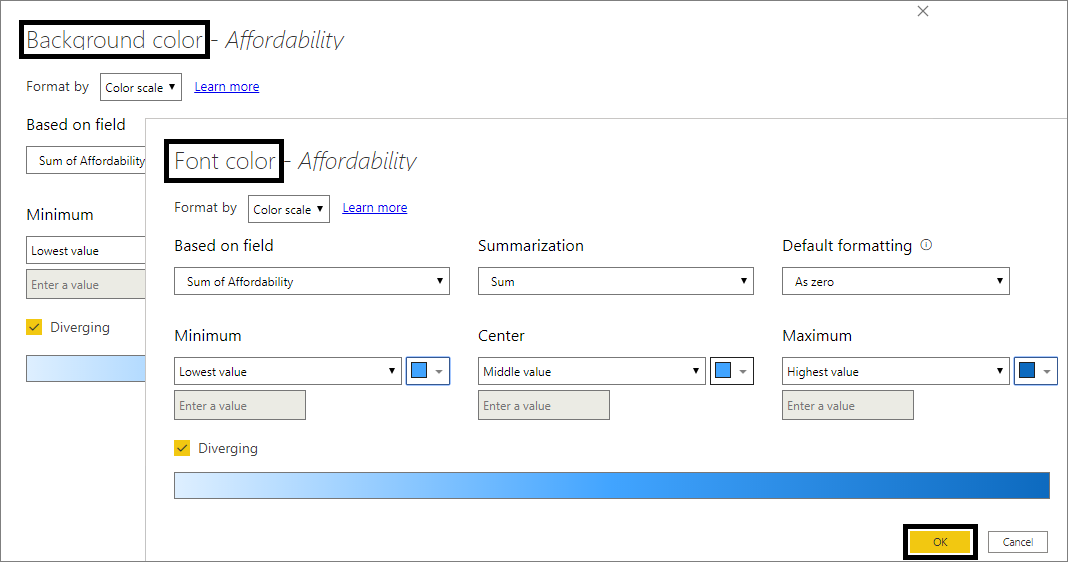
The Background shading or Font shading exchange box opens, with the name of the field you’re formatting in the title. After choosing the conditional formatting option, select OK.
The Background shading and Font shading choices are the same but affect the cell background shading and text style shading, respectively. You can apply the same or different conditional formatting to a field’s textual style shading and background shading. If you make a field’s text style and background a similar shading, the textual style blends into the background, so the table column shows just the colors.
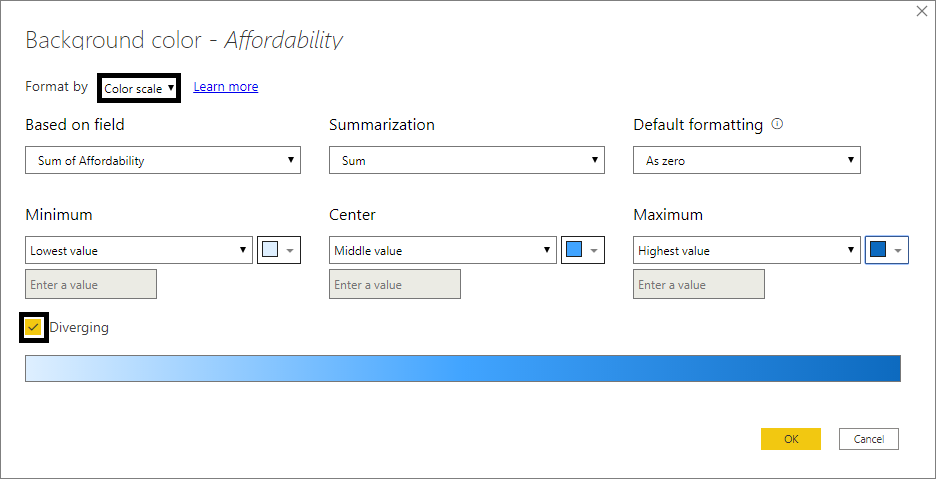
Color Formatting by Color Scale
To format cell background or text shading by the color scale, in the Format by field of the Background shading or Font shading dialog box.
Select Color scale Based on field, select the field to base the formatting on. You can base the formatting on the present field or on any field in your model that has numerical or shading data.
Under Summarization, specify the aggregation type you need to use for the selected field, Under Default formatting, select formatting to apply to the null value.
Under Minimum and Maximum, pick whether to apply the shading based on the lowest and highest field value, or on custom values you enter. Drop down and choose the color swatches you need to apply to the minimum and maximum values. Select the Diverging checkbox to also specify a Center value and color.
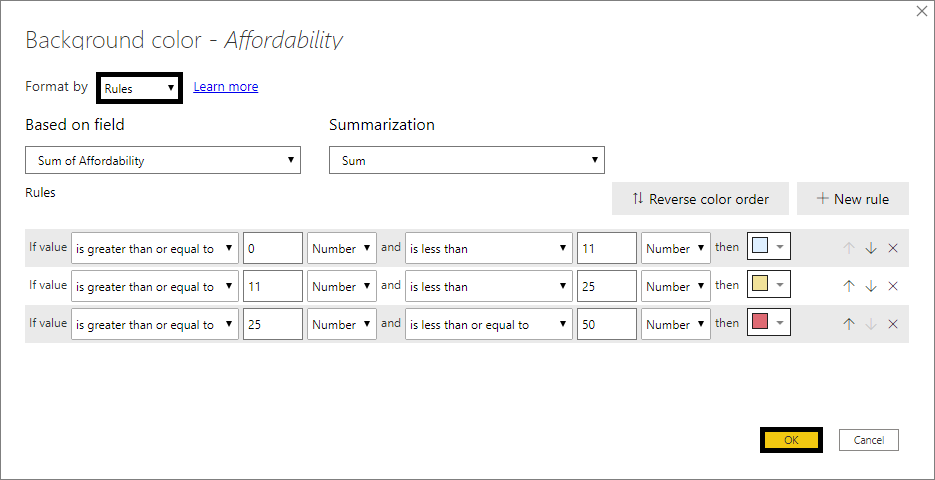
Color Formatting by Rules
To format cell background or text shading by rules, in the Format by field of the Background shading or Font shading dialog box, select Rules. Again, based on the field shows the field to base the formatting on, and Summarization shows the aggregation type for the field.
Under Rules, enter at least one or more value ranges, and set a shading for each one. Each value range has an If value condition, an and value condition, and a shading. Cell backgrounds or text styles in each value range are colored with the given shading.
Color Formatting by Values
If you have a field or measure shading name or hex value data, you can utilize conditional formatting to automatically apply those shades to a color background or text shading. You can likewise utilize custom logic to apply shades to the textual or background.
Color Formatting Based on Calculations
You can make a DAX calculation that outputs various values depending on the business logic conditions you select. Making a DAX equation is typically quicker than making different principles in the conditional formatting dialog.
Conclusion
Consequently, in this Conditional Formatting instructional exercise, we figured out how we can use Power BI Conditional formatting.
Therefore in the background, textual style, and data bar. Besides, on the off chance that we miss anything in this “Power BI Conditional Formatting Tutorial,” don’t hesitate to share with us.
If you need any consultancy in the data analytics, you can opt for our services.
You can visit our site. The link mentioned below:
https://www.loginworks.com/data_services_consulting
We hope you enjoyed this post; you can share your feedback and your opinion about the article in the comment section below.
- What Products Should You Sell on Amazon? - November 18, 2020
- 10 Reasons Why You Should Start Selling on Amazon - October 22, 2020
- Comparative Study of Top 6 Web Scraping Tools - September 3, 2020